Chapter 9: Cell Death, Including Apoptosis
You are here
9.1 Introduction
Necrotic cells are usually defined by the lack of integrity of the plasma membrane, which can be measured by the flow cytometer. In contrast, apoptotic cells have an intact plasma membrane. In vivo, except possibly in necrotic centres in large tumours, necrotic and apoptotic cells will be removed from the body by phagocytosis. In vitro, apoptotic cells will eventually lose integrity of the membrane, sometimes referred to as secondary necrosis. The clearest distinction between necrosis and apoptosis is that apoptosis is an orderly process designed to remove unwanted cells; it can also be triggered by damage to the cell. Necrosis is a disordered process. The difference is apparent in the changes in nuclear morphology and in the degradation in DNA; both alterations are structured in apoptosis and unstructured during necrosis.
9.2 Cell viability
Loss of integrity of the plasma membrane can be demonstrated either by using dyes, such as propidium iodide (PI), which are excluded by an intact membrane, or using fluorescent dyes which are retained in the cell only if the membrane is intact. In the latter category, fluorescein diacetate (FDA) or carboxyfluorescein diacetate are commonly used. FDA is uncharged and diffuses into cells. In the cell, it is converted to fluorescein, which being charged is retained in a viable cell. An example is shown in Figure 9.1. The viable cells are fluorescein +ve, PI -ve and the dead cell fluorescein -ve, PI +ve.
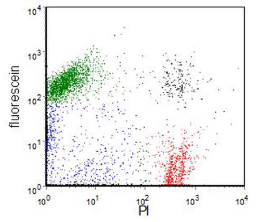
Figure 9.1. Human ovarian carcinoma cell line labelled with FDA and PI. Green: live cells. Red: dead cells. Some of the blue cells are probably apoptotic. The double stained cells (black) are clumps. Data file
9.3 Apoptosis
9.3.1 Introduction
Before commencing any study of apoptosis using flow cytometry, you should, whenever possible, first establish the presence of these cells visually and should not rely on the various flow cytometric assays. Apoptotic cells were originally identified by the characteristic changes in their nuclei; this is still the best method of confirming their identity. Nuclear changes can be observed by staining with a DNA dye and using fluorescence microscopy (Figure 9.2).
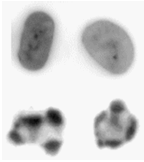
Figure 9.2. Normal (top row) and apoptotic HL60 (human promyelocytic cell line) cells, stained with PI and viewed by confocal microscopy.
The following features of the apoptotic cascade can be observed using flow cytometry.
- Expression of proteins involved in apoptosis
- Activation of caspases
- Changes in the mitochondrial membrane potential
- Changes in the plasma membrane
- Cell shrinkage
- Chromatin changes
- DNA degradation
The methods involved will be described in more detail in the following sections. A reviews of the literature on flow cytometry and apoptosis has been published by Ormerod (2001). Some of the experimental methods are also described by Ormerod (2000).
9.3.2 Protein expression
Any protein that is involved in the apoptotic process can be measured by flow cytometry as long as there is a suitable antibody and sufficient copies of the protein are present. Of particular importance are a family of enzymes called caspases (cysteine aspartate-specific proteases), which drive the apoptotic cascade, the Bcl-2 family of proteins, which control the cascade and the mitochondrial proteins, which play a central role in the promotion and control of the cascade.
There are now antibodies available to many proteins which are only found in apoptotic cells, such as cleaved poly-(ADP-ribose) polymerase (PARP) and activated caspases. Suitable methods are discussed in Chapter 5.
9.3.3 Activation of caspases
Caspases are found in normal cells as inactive zymogens (procaspases). Active caspases can activate other caspases, establishing a ‘caspase cascade’. Generally, they can be divided into initiator (for example, caspase 8) and executioner (for example, caspase 3) caspases.
Activated caspases can be observed in fixed cells using antibodies. Assays using unfixed, viable cells are based on a fluorescent compound linked covalently to a short peptide sequence specific for the active caspase of interest.
When rhodamine 110 - a green fluorescent dye excited at 488 nm - is attached to a peptide its fluorescence is quenched. Fluorescent rhodamine 110 is released when the peptide is cleaved by the appropriate caspase. The problem with this assay is that the rhodamine-peptide compound is slow to diffuse into live cells. Another assay that works on a similar principle uses reagents with the trade name, PhiPhiLux (OncoImmunin Inc.) (Komoriya et al., 2000). A fluorescent compound based on rhodamine is dimerised using a peptide linker. The close proximity of the two molecules quenches their fluorescence. In the cell, if the peptide is cleaved, two fluorescent monomers are released. An example is shown in Figure 9.3. The probe used was linked with the peptide sequence, DEVDGI, specific for caspase-3. TO-PRO-3, a dicycanine dye which binds to DNA but is excluded by viable cells, was added. There were some dead cells in the preparation of normal cells (revealed by positive staining for TO-PRO-3). After treatment with the cytotoxic drug, staurosporine, there was a population of apoptotic cells with intact membranes and a large increase in the percentage of cells taking up the DNA dye. These cells were negative for PhiPhiLux which had diffused out of cells with damaged membranes.
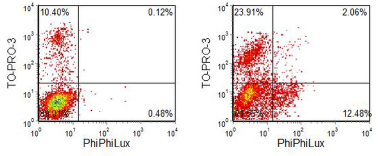
Figure 9.3. MDCK, dog kidney cell line. A. Untreated control. B. Incubated with staurosporine. The cells were loaded PhiPhiLux specific for caspase 3 and TO-PRO-3 added. Dual laser, 488 and 630 nm. Data supplied by Derek Davies, Sandra Watton and Julian Downward, Signal Transduction Laboratory, CRC-UK London Laboratory. Data file
A different approach is used in the so-called FLICA (fluorochrome-labelled inhibitor of caspase) assay (Bedner et al., 2000). Fluoryl methyl ketone (FMK) is attached to one end of the peptide sequence and carboxyfluorescein on the other. When the peptide binds to the active site of the caspase, the FMK probably reacts preventing further activity so that the fluorescent product will accumulate in cells with active caspases.
9.3.4 Changes in the mitochondrial membrane potential
The mitochondrion has a central role in apoptosis, during which the membrane potential collapses, a change which is best measured by flow cytometry (Zamzami et al., 1995). There are several dyes which are sequestered in the mitochondria (Galluzi et al., 2007). They include chloro-methyl-X rhosamine, rhodamine 123 and 3,3’-dihexyloxacarbocyanine - DiOC6(3). When the mitochondrial membrane potential (MMP) collapses, the dye redistributes through the cytoplasm and forms a new equilibrium with the external medium, resulting in a loss of dye from the cell. Another dicyanine dye is JC-1, whose fluorescence shifts from green to red depending on the state of aggregation of the dye so that, when the dye is concentrated in the mitochondria, it fluoresces red; on its release, it is diluted and fluoresces green. The ratio of green to red fluorescence is measured. The dye, tetramethylrhodamine, ethyl ester, perchlorate (TRME), works in a similar fashion. The fluorescence is quenched when the dye is sequestered in the mitochondria; on its release into the cytoplasm, its fluorescence increases.
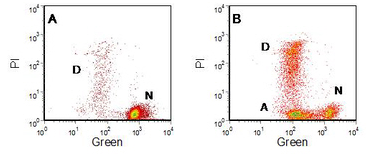
Figure 9.4. Human lymphoblastoid cell line, W1L2, labelled with DiOC6(3). PI added. A. Control. B. Incubated 16 hours with KCN. The labels indicate normal (N), apoptotic (A) and ‘necrotic’ (D) cells. Data file
Figure 9.4 shows the use of the dye, DiOC6(3), in observing a reduction in MMP during apoptosis. PI was added to distinguish the cells with damaged plasma membranes (‘secondary necrosis’). In the untreated, control, culture most of the cells are green positive and red (PI) negative; a few cells were dead (PI positive). In the cells incubated with KCN, there was a new population, green weak, PI negative; these are the apoptotic cells.
The reduction in the MMP uncouples the respiratory chain leading to an increase in superoxide anions and other reactive oxygen intermediates which can be detected using dihydroethidine (Zamzami et al., 1995a) or 2’, 7’-dichlorodihydrofluorescein (Verhaegen et al., 1995) (see Section 9.6). Other changes consequential to the loss of MMP are a reduction in the concentration of reduced glutathione, an increase in intracellular Ca++ concentration and a reduction in intracellular pH. Methods for measuring these parameters are described in Chapter 10.
9.3.5 Changes in the plasma membrane
Annexin V binding
During apoptosis phosphatidyl serine (PS) residues, which are normally located on the internal surface of the plasma membrane, redistribute to the external surface. PS binds the protein, Annexin V, and the change can be observed by incubating unfixed cells with labelled Annexin V (van Engeland et al., 1998) (Figure 9.5). Note that the dead and apoptotic cells have reduced forward and increased side scatter. A stain for Annexin V can readily be combined with a stain for surface antigens.
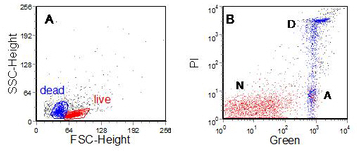
Figure 9.5. Human chronic lymphocytic leukaemia cells incubated in culture with chlorambucil followed by Annexin V-FITC. PI added. A. Light scatter. B. PI versus Annexin V. The labels indicate normal (N), apoptotic (A) and ‘necrotic’ (D) cells. Data supplied by Chris Pepper, Department of Haematology, Llandough Hospital, Penarth, Wales. Data file
Increase in membrane permeability
Apoptotic cells become more permeable to a variety of DNA-binding dyes, such as ethidium bromide, 7-AAD (Schmid et al., 1994), YO-PRO-1 (Idziorek et al., 1995) and Hoechst 33342 (Ormerod et al., 1993). The data in Figure 9.6 shows how apoptotic cells first take up YO-PRO-1, then, as the plasma membrane deteriorates, they take up increasing amounts of PI. The PI quenches the YO-PRO-1 fluorescence so the green fluorescence decreases. Finally the PI fluorescence also decreases as the DNA is degraded. The arrows mark the direction of movement of this ‘death cycle’.
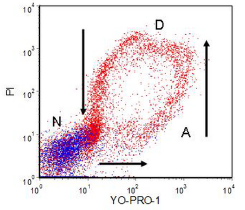
Figure 9.6. Human AML cells incubated in culture with chlorambucil. Incubated with YO-PRO-1; PI added. The cells coloured blue were identified from their light scatter as normal; (N), those coloured red are dead (D) and apoptotic (A) cells. See text for further discussion. Cells prepared by Louise Truran, then at Department of Haematology, University Hospital of Wales. Data file
The second example (Figure 9.7) shows the partial uptake of 7-AAD by apoptotic cells; when the plasma membrane is ruptured, the 7-AAD fluorescence increases one hundred fold. Note that there is a decrease in forward scatter during apoptosis. These immature thymocyctes had also been labelled with CD4-PE and CD8-FITC. The immature thymocyctes co-express the two antigens and colour gating on the live and apoptotic cells demonstrates that these surface proteins are down-regulated during apoptosis.
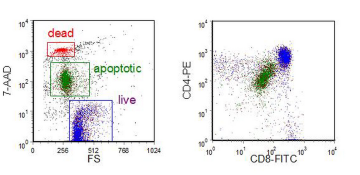
Figure 9.7. Immature human thymocytes incubated with dexamethasone in culture. The cells were then incubated with anti-CD4-PE and anti-CD8-FITC followed by 7-AAD. Data supplied by Ingrid Schmid, UCLA School of Medicine. Data file
9.3.6 DNA degradation
The DNA histogram
At a late stage in the apoptotic cascade, endonucleases break the linkers between the nucleosomes, one of the units of chromatin organisation. Consequently, large numbers of small fragments of DNA, whose sizes are oligomers of about 180 bp, accumulate in the cell. If cells are fixed in ethanol and subsequently rehydrated, some of the lower molecular weight DNA leaches out, lowering the DNA content. These cells can be observed as a hypodiploid or 'sub-G1' peak in a DNA histogram (Figure 9.8). The peak may be contaminated with debris which can often be eliminated from the analysis by using light scatter. The amount of DNA extracted - and hence the position of the sub-G1 peak -depends on the type of cell being studied and the buffer in which the cells are resuspended (Gong et al., 1994).
If this method is used to count the percentage of apoptotic cells, there should be a clear sub-G1 peak, as shown in the Figure. It is incorrect, as is often done, to set a region below G1 and assert that the number of particles therein is a count of the apoptotic cells. While degraded material is this region may have derived from apoptotic cells, one apoptotic cell could have given rise to several fragments.
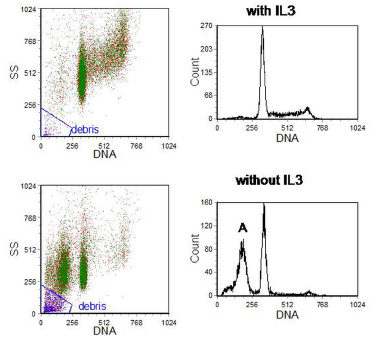
Figure 9.8. Murine haemopoietic cell line, BAF3, grown for 16 hours either with or without the growth factor, IL-3. Cells fixed in 70% ethanol and resuspended in PBS with PI. The DNA histograms have been gated to include only single cells (plot of DNA peak versus area not shown) and to exclude debris. ‘A’ marks the sub-G1 peak (apoptotic cells). Data file
The TUNEL assay
The enzyme, terminal deoxynucleotidyl transferase (Tdt), will add nucleotides to the 5’ ends of the fragments of DNA in apoptotic cells. A labelled nucleotide is used (for example, BrdUTP ) which can subsequently be visualised (in this case, with anti-BrdUrd-FITC). Before fixation in ethanol, the cells are fixed in formaldehyde (typically 1% para-formaldehyde), in order to crosslink the DNA fragments into the cell and to maximise the number of broken DNA ends. Because the fragmented DNA is retained, the DNA content of the apoptotic cells will reflect the cell cycle phase from apoptosis was initiated.
Four examples are shown in Figures 9.9 to 9.12. In the first, the labelled nucleotide was biotin-11-dUTP which was visualised with streptavidin-FITC. The cells had undergone apoptosis from G1 of the cell cycle. In the other examples, BrdUTP followed by anti-BrdUrd-FITC was used. In Figure 9.10, the cells that underwent apoptosis were from the S phase.
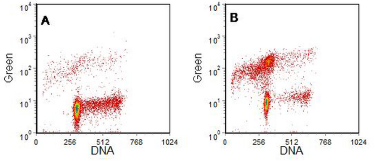
Figure 9.9. Cells as described in Figure 9.8. A, incubated with and B without IL-3. Labelled using the TUNEL assay. Cells prepared by Simone Detre, Academic Dept. of Biochemistry, Royal Marsden Hospital, London. Data file
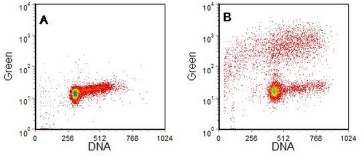
Figure 9.10. HL60 (human promyelocytic cell line) cells. A, control cells; B, incubated for 4 hours with camptothecin. TUNEL assay. Cells supplied by Phoenix Flow Systems. Data file
The last two examples (Figures 9.11 and 12) show data from a fine needle aspirate (FNA) of a breast carcinoma. The cells were sorted onto a microscope slide and the fluorescent images captured. The images of the nuclei from the labelled cells are not as clear cut as those from cell cultures but the morphology is not inconsistent with that expected from apoptotic cells. In Figure 9.12, some of the sorted cells had normal nuclei with brightly stained apoptotic bodies in the cytoplasm. These appear to be tumour cells which have phagocytosed a neighbouring apoptotic cell (Dowsett et al., 1998).
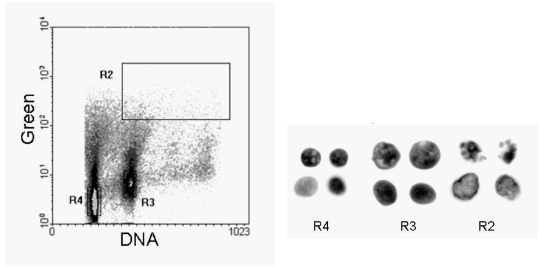
Figure 9.11. Fine needle aspirate from a breast carcinoma labelled by the TUNEL assay. Cells were sorted onto microscope slides and images captured by fluorescence microscopy. Region, R4, are diploid nuclei; R3, aneuploid and R2, the labelled aneuploid nuclei.
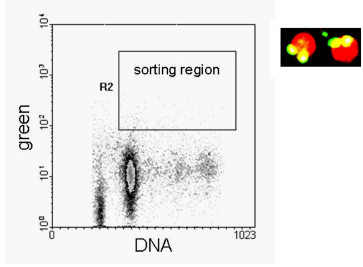
Figure 9.12. As Figure 9.11. The photograph shows cell sorted from the region indicated.
9.4 References
Bedner E., Smolewski P., Amstad P., Darzynkiewicz Z. (2000) Activation of caspases measured in situ by binding of fluorochrome-labeled inhibitors of caspases (FLICA): correlation with DNA fragmentation. Exp Cell Res, 259:308-313.
Dowsett, M., Detre, S., Ormerod, M. G., Ellis, P. A., Mainwaring, P. N., Titley, J. C. and Smith, I. E. (1998) Analysis and sorting of apoptotic cells from fine needle aspirates of excised primary breast carcinomas Cytometry 32:291-300.
Galluzzi L, Zamzami N, de La Motte Rouge T, Lemaire C, Brenner C, Kroemer G. (2007) Methods for the assessment of mitochondrial membrane permeabilization in apoptosis. Apoptosis 12: 803-13.
Gong J, Traganos F, Darzynkiewicz Z. (1994) A selective procedure for DNA extraction from apoptotic cells applicable for gel electrophoresis and flow cytometry. Anal. Biochem. 218: 314-9.
Idziorek, T., Estaquier, J., De Bels, F. and Ameisen, J.-C. (1995) YOPRO-1 permits cytofluorometric analysis of programmed cell death (apoptosis) without interfering with cell viability. J. Immun. Meth. 185:249-258.
Komoriya A.,. Packard B.Z, Brown M.J., WuM.-L., and Henkart P.A. (2000) Assessment of caspase activities in intact apoptotic thymocytes Using cell-permeable fluorogenic caspase substrates. J. Exp. Med. 191:1819-1828.
Ormerod, M.G. (2000) Flow Cytometry in the study of apoptosis. In: Ormerod MG, editor. Flow Cytometry. A Practical Approach. 3rd ed. Oxford University Press, Oxford. P. 83-97.
Ormerod, M.G. (2001) Using flow cytometry to follow the apoptotic cascade. Redox Report, 6:275-287.
Ormerod, M.G., Sun, X.-M., Snowden, R.T., Davies, R., Fearnhead, H. and Cohen, G.M.(1993) Increased membrane permeability of apoptotic thymocytes: a flow cytometric study.Cytometry 14:595-602.
Schmid, I., Uitenbogaart, C.H. and Giorgi, J.V. (1994) Sensitive method for measuring apoptosis and cell surface phenotype in human thymocytes by flow cytometry. Cytometry 15:12-20.
Van Engeland, M., Nieland, L.J.W., Ramaekerss, F.C.S., Schutte, B. and Reutelingsperger, C.P.M. (1998) Annexin V-affinity assay: a review on an apoptosis detection system based on phosphatidylserine exposure. Cytometry 31:1-9.
Verhaegen S, McGowan AJ, Brophy AR, Fernandes RS, Cotter TG. (1995) Inhibition of apoptosis by antioxidants in the human HL-60 leukemia cell line. Biochem. Pharmacol. 50:1021-1029.
Zamzami, N., Marchetti, P., Castedo, M., Zanin, C., Vaysière, J.-L., Petit, P.X. and Kroemer, G. (1995) Reduction in mitochondrial potential constitutes an early irreversible step of programmed lymphocyte death in vivo. J. Exp. Med. 181:1661-1672.