Chapter 6: DNA Analysis
You are here
6.1 Introduction
DNA analysis is, after immunofluorescence, the second most important application of flow cytometry. By measuring the DNA content of individual cells, we obtain information about their ploidy (seeSection 6.3), of particular relevance in tumours, and, for a population, the distribution of cells across the cell cycle. The relationship between the DNA histogram and the cell cycle is illustrated in Figure 6.1. The figure does not show the cells in G0 (out of cycle), which have the same DNA content as cells in G1.

Figure 6.1. Relationship between the cell cycle and the DNA histogram.
6.2 Staining the cells
To measure the DNA content, the cells have to be stained with a fluorescent dye that binds to DNA in a manner that reflects accurately the amount of DNA present. Fortunately, there are several suitable compounds available. These dyes are only weakly fluorescent in aqueous solution but fluoresce strongly when bound to DNA due to the hydrophobic nature of their environment. The dyes in common use are listed in Table 3.2 (Chapter 3, Section 3.3.3).
The most widely used dye is propidium iodide (PI), which has red fluorescence and can be excited at 488 nm. PI has two disadvantages; it stains all double stranded nucleic acids so the cells have to be incubated with RNase to remove any double stranded RNA and the dye is excluded by the plasma membrane so that the cells have to fixed or permeabilised before adding the dye. Suitable protocols for use with PI are to be found in Ormerod (2000) and Darzynkiewicz et al. (1994). The simplest method is to fix the cells in 70% ethanol. An alternative method is to enucleate the cells by suspending them in a buffer containing a detergent (Vindelov, 1983; Petersen et al., 1985). Methods for the combined measurement of proteins and DNA are discussed in Section 6.7.2. A DNA histogram typical of that obtained from a clinical sample using PI is shown in Figure 6.2. The stromal population of normal, diploid, cells is usually not cycling.

Figure 6.2. DNA histogram from a fine needle aspirate of a breast carcinoma. The aspirate was centrifuged and the cells resuspended in a buffer containing detergent (to release the nuclei), PI and RNase. There are normal, diploid cells present together with an aneuploid tumour.
If a UV or violet laser is available, DAPI, which also requires permeabilisation but is DNA specific, is capable of giving high quality histograms. To observe a DNA histogram in viable cells without permeabilisation either DRAQ5, one of the Vybrant DyeCycle compounds or the bis-benzimadazole, Hoechst 33342, can be used. The latter needs a UV laser for excitation. For each type of cell, preliminary experiments are needed to determine the correct time of incubation and concentration of the dye to give a satisfactory DNA histogram.
Clinical specimens are often studied by extracting nuclei from routinely processed (that is, formalin-fixed, paraffin embedded) tissue. Fifty µm thick sections are cut from histological blocks, the paraffin removed and the nuclei extracted by treatment with pepsin (Hedley et al., 1983). The quality of the histograms obtained, which can be surprisingly good, depends on the way in which the tissue was initially handled. It can often be improved by incubating the tissue sections at 80°C before treating with pepsin (Leers et al., 1999). An example of a DNA histogram obtained from formalin-fixed material can be found in Figure 6.11.
6.3 Ploidy
The number of chromosomes in a germ cell (gamete) is called the haploid number, n, for that species and the number in a somatic cell, the diploid number, 2n. Occasionally some somatic cells may be tetraploid (4n) or even octaploid (8n). The number of chromosomes in a tumour is frequently greater than 2n (hyperdiploid) and sometimes less (hypodiploid). An abnormal number of chromosomes is called aneuploidy and this is reflected by a change in the amount of DNA.
When aneuploidy is measured as a change in DNA content, as opposed to a change in the number of chromosomes, it should be referred to as DNA aneuploidy. The DNA content of a tumour may be expressed as the DNA index (DI) defined as the ratio between the DNA content of a tumour cell and that of a normal diploid cell.
In clinical samples, chicken or trout erythrocytes are sometimes added to the sample to act as markers so that the ploidy of the sample can be more easily determined. Avian and fish erythrocytes are nucleated and the DNA content of these two species is less than that of human cells. An example is shown in Figure 6.3.
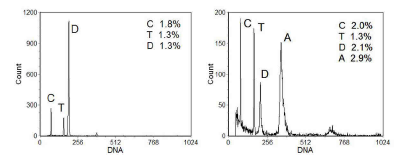
Figure 6.3. DNA histograms from two breast carcinomas. C: chicken erythrocytes; T: trout erythrocytes; D: diploid cells: A: aneuploid cells. The widths of the peaks (CV) are also shown. Cells prepared by the Vindelov method (Vindelov, 1983) and stained with PI. Data supplied by Gyda Otteson & Ib Christensen, Finsen Laboratory, Copenhagen. Data file
6.4 Quality of the DNA histogram
The quality of a DNA histogram is estimated from the width of the peak of DNA from cells in G1 of the cycle. This is measured by the coefficient of variation (CV) across the peak and is calculated from the standard deviation (SD).
CV = 100 x SD/(peak channel)%, where the peak channel is the mean channel number of the peak.
The smaller the CV of the peaks in the DNA histogram, the more accurate is the measurement of ploidy and the better the estimation of the percentage of cells in the different compartments of the cell cycle. It is essential that any unnecessary broadening of the peaks due to misalignment of the instrument should be eliminated. It is possible to obtain CVs as low as 1%, although in aneuploid tumours and cultured cells the the best CV may be closer to 2% due to the heterogeneity of the DNA content (see Figure 6.3). The number of clumps and the amount of debris present are also important factors.
The key elements in obtaining a histogram of high quality are sample preparation, instrument alignment and the data analysis.
The object of sample preparation is to obtain single cells (or nuclei) with the minimum of debris and clumps. The best preparation will be obtained by preparing nuclei, as in Figure 6.3 for which the method described by Vindelov (1983) was used. When staining fixed cells with propidium iodide, sufficient time must be allowed for the RNase to remove all double-stranded RNA. If the cells have been fixed, leaving them overnight at 4°C will often improve the histogram. If the cell (or nuclei) concentration is high, there should be sufficient dye present to maintain stoichiometric binding.
The performance of the instrument should be checked daily using fluorescent beads of known CV; these can be purchased from several manufacturers. The CV and the peak channel number for a standard set of conditions (laser power, PMT voltage and gain) should be recorded. If these fall outside pre-determined limits (for example, 2% CV), action should be taken to restore the instrument's performance.
Check that the flow rate has not been accidentally set too high.
Check that there is not a partial blockage of the flow cell.
If possible (with a conventional cell sorter) realign the instrument.
If realignment is not possible (most bench top instruments), call in the service engineer.
Any perturbation of the sample stream in the cytometer will increase the CV and for this reason the concentration of cells or nuclei should be kept high (between 5x10⁵ and 2x10⁶/ml) and the flow rate low. The DNA histogram should be displayed on a linear scale.
6.5 Excluding clumps from the analysis
Two nuclei or cells in G1 of the cell cycle stuck together will have the same DNA content as a single cell in G2 and the two should be distinguished if the DNA histogram is to reflect accurately the state of the cell cycle. In instruments designed for DNA analysis, the laser beam is focused to give an elliptical cross-section whose width is close to the diameter of a typical nucleus. As a particle crosses the beam, the integrated fluorescence will be proportional to the DNA content; the width of the signal in time will be the addition of the width of the particle and that of the laser beam. Because of the flow system, clumps of cells will tend to align along the direction of flow and will give a wider signal than single cells. Cells in G2/M have twice the DNA of a cell in G1 but the nuclear diameter is only about 25% greater so that they will give a higher peak signal compared to two clumped cells in G1 but a narrower width (Figure 6.4). Some instruments are designed to display width against area, others peak height against area. Examples of both types of analysis are shown in Figures 6.5 and 6.6.
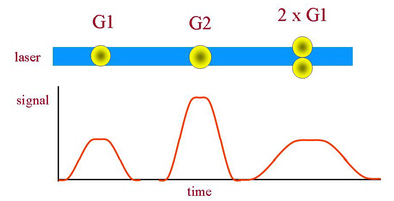
Figure 6.4. The signals generated when fluorescent nuclei pass through the laser beam. See text for further explanation

Figure 6.5. Analysis to select single cells using a display of the signal peak against area The arrow points to the cluster from two clumped cells, both in G1. Ethanol fixed cells stained with PI. Data recorded on a Coulter Elite. Data file
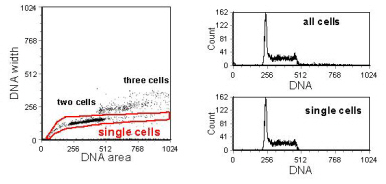
Figure 6.6. Analysis to select single cells using a display of the signal width versus area. Ethanol fixed cells stained with PI. Data recorded on a BD FACScan. Data file
The regions in Figures 6.5 and 6.6 have been drawn to include events with a DNA content less than G1 and those with a DNA content greater than G2. This enables a complete picture of the DNA histogram to be obtained. In Figure 6.6, there are a few single cells with a DNA content greater than the diploid G2. These are cells which have endo-reduplicated (that is, returned to G1 from G2/M without dividing). A good example of this behaviour, often observed in cultured cells, is shown inFigure 6.7.
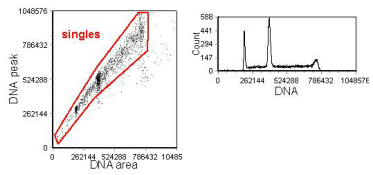
Figure 6.7. Analysis to select single cells using a display of the signal peak against area. The cultured cells (CCRF-CEM) were fixed in formalin followed by methanol and stained with PI. Note there are a diploid and a tetraploid population present and that the diploid G2 has the same DNA content as the tetraploid G1. Data recorded on a Coulter FCS500 and supplied by Vincent Shankey, Beckman Coulter, Miami. Data file
6.6 Computer analysis of the cell cycle phases
Figure 6.8 shows superimposed DNA histograms from G1, S and G2/M phases of the cycle for some rapidly cycling cells. The phases were separated analytically by pulse-labelling the S phase cells with 5'-bromodeoxyuridine (BrdUrd) (see Chapter 7). It can be seen that, there is considerable overlap between early S phase and G1 and between late S phase and G2/M due to broadening of the distribution caused by variability in the staining of the cells and also instrumental variability. The problem with analysis of a DNA histogram is finding a model to estimate reliably the extent of the overlap.
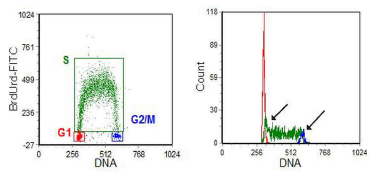
Figure 6.8. V79 Chinese Hamster cells pulse-labelled with BrdUrd and labelled with anti-BrdUrd-FITC (S phase cells) and PI (cell cycle).
Regions have been set on the G1, S and G2/M populations and their DNA histograms have been overlayed. The overlap between G1 and early S and G2/M and late S phases are arrowed. Data supplied by George Wilson, then at the CRC Laboratories, Mount Vernon, UK. Data file
The variety of approaches for modelling the cell cycle phases have been summarized by Rabinovitch (1994) and Ormerod (1994) . The most rigorous algorithm is probably the polynomial method of Dean and Jett. Few algorithms will handle every histogram, particularly if the data is noisy or the CV large or if the cell cycle is severely distorted. The numbers generated should not be blindly accepted but should be used in conjunction with the original DNA histogram. It should also be appreciated that the numbers produced by the computer program are only estimates.
Figure 6.9 shows a computer analysis of some DNA histograms. The analysis program, Cylchred, uses the ‘pragmatic approach' of Watson (Watson et al., 1987; Ormerod et al., 1987). It was written by the author, modified and implemented by Terry Hoy, Cardiff. The two commercial DNA analysis software packages commonly used are ModFit (Verity Software) and Multicycle (Phoenix Flow Systems).
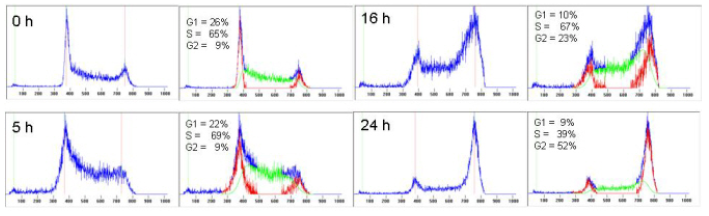
Figure 6.9. Cells from a murine leukaemic cell line, L1210, at different times after incubation with a Pt dicarboxylate. Cells fixed in 70% ethanol; PI stain.
6.7 Multiparameter measurement
6.7.1 Combining light scatter with DNA analysis
Sometimes light scatter will reveal extra information. In particular, it can allow separation of different populations. In Figure 6.10, gates on light scatter have been used to separate cells showing a normal cell cycle from those blocked in G2, which have increased in size.
The other example shows nuclei which have been extracted from a formalin-fixed, paraffin-embedded breast carcinoma. The ungated DNA histogram shows a diploid population and an aneuploid tumour. In breast samples prepared in this manner, the nuclei from normal cells have less side scatter (Ormerod et al., 1995). The tumour nuclei, which have greater side scatter have two sub-populations. Gating on these reveals that the tumour has a diploid as well as an aneuploid component (Figure 6.11).

Figure 6.10. A murine leukaemic cell line 48 h after incubation with a Pt di-carboxylate. The light scatter separates two populations of cells; the larger cells being those blocked in G2. See text for further details. Cells fixed in 70% ethanol; PI stain. Data file
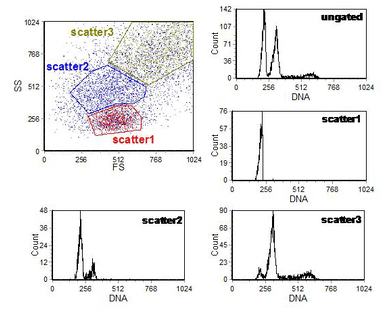
Figure 6.11. Nuclei from a breast carcinoma. Light scatter has been used to separate two diploid and one aneuploid population. See text for further details. PI stain. Data file

Figure 6.12. Ascitic cells from a patient with ovarian carcinoma stained with the MOv18 antibody to folate binding protein on the cell (labelled with FITC), fixed in paraformaldehyde and lysolecithin and then stained with an antibody to vimentin (labelled with PE). The epithelial tumour cells are aneuploid while the normal, vimentin expressing cells are diploid. PI was added as a DNA stain. Data from W. E. Corver, Leiden. Data file
6.7.2 Combining immunofluorescence and a DNA stain
Combining PI with a single antibody labelled with fluorescein does not present any problems. If two antibodies are labelled with fluorescein and phycoerythrin (PE), the spectral overlap between PE and PI can usually, but not always, be compensated (see Figure 6.12). It is best to use a DNA dyes whose emission spectra have minimal overlap with the fluorochromes on the antibodies. If a UV or violet laser is available, DAPI can be used, in which case the full range of colours from the blue laser are available.
If labels for surface antigens are combined with DRAQ5 or one of the other DNA stains taken up by viable cells, fixation is not required. However, the use of PI or DAPI will require fixation, which can cause some difficulty. The conditions need to be selected to ensure that a high quality DNA histogram is obtained. Fixatives such as methanol are seldom compatible with a surface stain. Figure 6.13shows data obtained by permeabilising the cells after labelling for surface antigens. Although the method is sub-optimal for both cell surface labelling and for the DNA histogram, the ploidy of the cells can be measured.
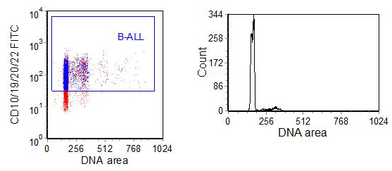
Figure 6.13. An B-acute lymphocytic leukaemias was labelled using using the Cycloscope kit. The B-cells were identified using a cocktail of B cell antigens - CD10, 19, 20 and 22; PI was then added. The tumour was aneuploid (DI = 1.09). Data supplied by Pablo Penalosa, Cytognos SL. Data file
For intracellular antigens, the optimum method for fixation will depend on the antigen under study. Typical procedures include:
- Fixation in 70% ethanol at 0°C;Fixation in absolute methanol at - 20°C;
- Fixation in 1% paraformaldehyde followed by methanol, both at 0°C;
- Incubation of fresh cells with antibody on ice in the presence of detergent;
- For nuclear antigens, enucleation with a strong detergent followed by fixation.
The next three examples show nuclear stains using antibodies to cell cycle related proteins. The first (Figure 6.14A) shows the distribution of cyclin A through the cell cycle. The cyclin is degraded during mitosis. In the second (Figure 6.14B) the cells were stained for an antibody to p-histone H3, which is specific for mitotic cells. In Figure 6.15, the cells were stained for cyclin B2, which is expressed in G2 but is negative in mitotic cells.
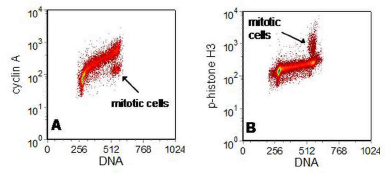
Figure 6.14. K562 cells stained (A) for cyclin A and (B) for p-histone H3 (FITC). The cells were fixed in 1% formalin followed by methanol. DNA stain: PI.
Data supplied by Vincent Shankey, Beckman Coulter, Miami. Data file

Figure 6.15. Human lymphoblastic cell line, W1L2, stained for cyclin B-FITC. Cells were fixed in 70% ethanol. DNA stain: PI. Data file
6.8 References
Darzynkiewicz, Z., Robinson, J.P. and Crissman, H.A. (eds.) (1994) Flow Cytometry. Methods in Cell Biology, 41 & 42, Academic Press, Inc., San Diego.
Hedley, D.W., Friedlander, M.I., Taylor, I.W., Rugg, C.A. And Musgrove, E.A. (1983) Method for analysis of cellular DNA content of paraffin-embedded pathological material using flow cytometry.J. Histochem. Cytochem. 33: 1333-1335.
Leers, M.P., Schutte, B., Theunissen, P.H., Ramaekers, F.C. and Nap, M. (1999) Heat pretreatment increases resolution in DNA flow cytometry of paraffin-embedded tumor tissue.Cytometry 35: 260-266.
Ormerod, M.G., Payne, A.W.R. and Watson, J.V. (1987) Improved program for the analysis of DNA histograms. Cytometry 8: 637-641.
Ormerod M.G.,Titley J.T. and Imrie P. R. (1995) The use of light scatter when recording a DNA histogram from paraffin-embedded tissue. Cytometry, 21, 294-299.
Ormerod, M.G. (2000). Flow Cytometry. A Practical Approach. Ormerod, M.G. (ed). 3rd edition. Oxford University Press, Oxford. 83-97.
Petersen, S.E. (1985) Flow cytometry of human colorectal tumors: nuclear isolation by detergent technique. Cytometry 6, 452-460.
Vindelov, L.L., Christensen, I.J. and Nissen, N.I. (1983) A detergent-trypsin method for the preparation of nuclei for flow cytometric DNA analysis. Cytometry 3, 323-327.
Rabinovitch, P.S. (1994) in Darzynkiewicz, Z., Robinson, J.P. and Crissman, H.A. (eds.) Flow Cytometry. Methods in Cell Biology, 41, 264-296. Academic Press, Inc., San Diego.
Rabinovitch, P.S., Torres, R.M. and Engel, D. (1986) Simultaneous cell cycle analysis and twocolor surface immunofluorescence using 7-amino-actinomycin D and single laser excitation. J. Immunol. 136, 2769-2776.
Watson, J.V., Chambers, S.H. and Smith, P.J. (1987) A pragmatic approach to the analysis of DNA histograms with a definable G1 peak. Cytometry 8: 1-8.