Chapter 1: Introduction
You are here
1.1 Introductory Remarks
As the name implies, flow cytometry is the measurement of cells in a flow system, which delivers the cells singly past a point of measurement. In theory, there are many types of measurements that could be made but, in practice, the name refers to instruments in which light is focused at the point of measurement. The scattered light and fluorescence of different wavelengths are then recorded. Typically, light scatter at two different angles and from one to six or more fluorescences will be measured. Although cells (mammalian, plant, algae, yeast, bacteria) are usually analysed, other particles, such as nuclei, chromosomes or small beads, can also be studied.
Some organisms, such as marine algae, are inherently fluorescent but, in general, the fluorescences arise from different labels. Fluorescent chemicals may used to label cell components, such as DNA, directly; others are attached to antibodies against a wide variety of cellular proteins.
As will be emphasised throughout this book, the value of the technique lies in the ability to make measurements on large numbers of single cells within a short period of time (tens of seconds to minutes). The heterogeneity of populations can be revealed and different subsets of cells identified and quantified. Selected cell populations can also be physically sorted for further study.
The major disadvantage of flow cytometry is that it requires a suspension of single cells or other particles, with minimum clumps and debris. This means that the tissue architecture and any information about the spatial relationship between different cells are lost when single cells or nuclei are prepared.
1.2 Data presentation
Data are usually shown either as single parameter histograms (Figure 1.1) or as two parameter correlated plots, often called cytograms. A cytogram may be presented as a dot plot, a density or a contour plot (Figure 1.2). In a dot plot, each cell recorded is shown as a single dot. This is the form in which data are shown during data acquisition.
Figure 1.2 shows forward scatter on the x-axis and side scatter on the y-axis. The significance of these parameters is discussed in Chapter 4.
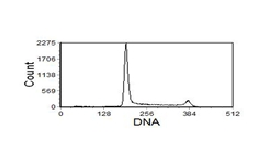
Figure 1.1. A histogram showing mammalian cells stained for DNA content using the red fluorescent dye, propidium iodide.Data file
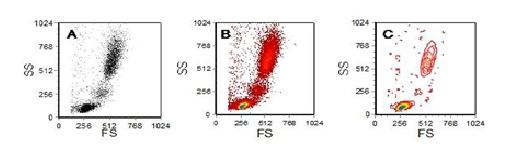
Figure 1.2. Cytograms of the side and forward angle light scatter (SS and FS) from human peripheral blood leucocytes. A. Dot plot; B. Density plot; C. Contour plot. Data file
1.3 Further reading
Darzynkiewicz, Z., Crissman, H.A. and Robinson, J.P. (eds.) (2001) Cytometry. 3rd edition. Part A and B. Methods in Cell Biology, Volume 63 and 64, Academic Press, San Diego, USA. (ISBN 0-12-203053-2 (Part A); 0-12-203054-0 (Part B)).
Davey, H.,M. and Kell, D.,B. (1996) Flow cytometry and cell sorting of heterogeneous microbial populations: the importance of single-cell analyses. Microbiol Rev. 60:641-96.
Givan, A.L. (2001). Flow Cytometry: First Principles. 2nd Edition. John Wiley and Sons, Inc., New York. (ISBN 0-471-38224-8).
Legendre, L., Courties, C. and Troussellier, M. (2001 ) Flow cytometry in oceanography 1989--1999: environmental challenges and research trends. Cytometry 44:164-72.
Ormerod, M.G. (ed.) (2000) Flow cytometry - A practical approach. 3rd edition. Oxford University Press, Oxford, UK. (ISBN 0-19-963824-1).
Robinson, J.P., Darzynkiewicz, Z., Dean, P.N., Dressler, L., Orfao, A., Rabinovitch, P.S., Stewart, C.C., Tanke, H.J. and Wheeles L.L., eds. (1998, updated quarterly) Current Protocols in Cytometry. Current Protocols, Wiley-Liss, New York, N.Y. (ISBN 0-471-16131-4).
Shapiro, H.M. (2003) Practical Flow Cytometry. 4th edition. Wiley-Liss, New York. (ISBN 0-471-41125-6).