Chapter 10: Some Other Applications
You are here
10.1 Introduction
In this final chapter, I describe briefly some of the other applications of flow cytometry to mammalian biology. A few, such as the measurement of mitochondrial membrane potential or the activity of intracellular enzymes have already been described in other Chapters, particularly Chapter 9. This chapter is not comprehensive but aims to cover most of the applications which the reader is likely to encounter.
10.2 Production of intracellular oxidative species
There are several compounds which, in their reduced form, are non-fluorescent but which generate a fluorescent compound upon oxidation. Such compounds include dihydrorhodamine 123, dihydroethidium and 2', 7'-dihydrodichlorofluorescein (dichlorofluorescin, DCFH) (Robinson et al., 1994). The first two compounds diffuse freely into cells. Upon oxidation, rhodamine 123 fluoresces green and is concentrated in the mitochondria while ethidium will bind to DNA and fluoresce red. DCFH can be loaded into cells as an ester. After conversion of the ester to DCFH by intracellular esterases, oxidation will yield a fluorescent product.
These compounds have been used to observe oxidative burst in neutrophils (Emmendørfer et al., 1990), changes in the concentration of oxidative products during apoptosis (Verhaegen et al., 1995; Zamzami et al., 1995) and also the production of intracellular oxidative species by ionising radiation (Ormerod, M.G. and Peacock, J.H., unpublished work).
Figure 10.1 shows an assay of oxidative burst in human peripheral blood granulocytes induced by muramyl dipeptide (a bacterial cell-wall component) using dihydroethidium. In functional studies of neutrophils, measurement of oxidative burst is often combined with other measurements, particularly phagocytosis (for example, see Bashir et al., 2008). Phagocytosis can be measured using either protein-coated beads or FITC-labelled bacteria (Lehmann et al., 2000).
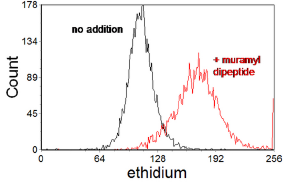
Figure 10.1. Measurement of oxidative burst in human peripheral blood granulocytes using dihydroethidium. On oxidation, ethidium is produced which binds to DNA and fluoresces red. The histogram shows the red fluorescence before and after incubation with 10 mM muramyl dipeptide for 15 min. The granulocytes were displayed by gating an a scatter plot. Data supplied by Richard Allman & Amanda J. Taylor, then at the Velindre Hospital, Cardiff, Wales. Data file
10.3 Intracellular calcium ions.
Calcium ions have an important role in cell signalling and the intracellular concentration of calcium ions may show transient changes in response to external stimuli. There are several fluorescent dyes whose properties depend on the amount of bound Ca++. For flow cytometry, the most useful of these is indo-1 whose emission wavelength changes on binding calcium (see Figure 3.4, Chapter 3). It is loaded into the cell in the form of the acetoxymethyl ester.
Indo-1 is excited in the UV. A mixture of fluo-3 and Fura red can be used for work with a flow cytometer limited to excitation at 488 nm. Fluo-3 has a maximal fluorescence at 530 nm; its fluorescence increases with increasing Ca++ concentration. Fura Red has a maximal fluorescence at 650 nm which decreases with increasing Ca++ concentration. The 525S/650 fluorescence ratio can be used to follow changes in Ca++ concentration (Figure 10.2).
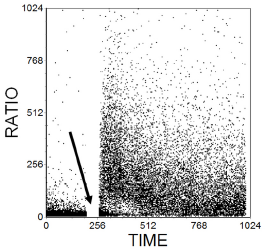
Figure 10.2. Estimation of the concentration of intracellular Ca++ ions. Cells from the T human cell line, JurkatJ6, labelled with Fluo3 and Fura Red. The ratio of the fluorescences of the two dyes at 525 and 675 nm respectively was recorded against time. At the time marked by the arrow, the sample was removed and anti-CD3 added before continuing recording data. The antibody caused a transient rise in Ca2+ concentration. Data supplied by Simon Hall and Maria Daly, then at Glaxo Welcome, Stevenage, UK. Data file
Although the measurement of qualitative changes in the concentration of intracellular Ca++ is straight forward, quantitative measurements are more difficult. Calibration of the system can be a problem (see discussion by Rabinovitch and June, 1994, who also describe the experimental methods).
10.4 Intracellular pH.
This is a measurement that is best made with a dye whose wavelength of emission is pH dependent. Invitrogen (Molecular Probes) have produced a series of benzo[c]xanthene dyes with these properties. The compound referred to as carboxy-SNARF-1 is optimally excited at 514 nm but can also be excited at 488 nm. The ratio of the orange (580) to red (630) fluorescent emissions is used to measure pH (for a discussion of ratio measurements, see Chapter 3, Section 3.3.5).
10.5 Intracellular glutathione.
There are fluorescent compounds which react with thiols in cells and also non-fluorescent compounds which react with thiols to give a fluorescent product. A problem with many compounds is the unacceptably high background staining (Chow & Hedley, 1994). If a UV or violet laser is available, the preferred reagent for rodent cells is monochlorobimane (MClB). MClB crosses the plasma membrane and reacts with glutathione through glutathione-S-transferase to give a fluorescent conjugate, which is trapped in the cell. While this assay gives excellent results with rodent cells, it is less effective in human cells which lack the necessary variant of glutathione-S-transferase. As an alternative monobromobimane (MBrB) is used. MBrB reacts directly with sulphydryl groups; it is not specific for glutathione but the reaction with protein SH is far slower than the reaction with glutathione enabling an assay for the latter to be made. Results from an assay of a pair of human ovarian cell lines are shown in Figure 10.3.
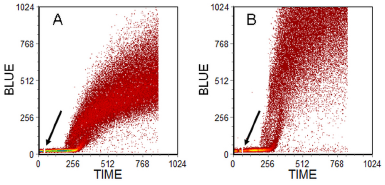
Figure 10.3. Human ovarian carcinoma cell line. A: parent line. B: a sub-line resistant to cis-platin. PI was added before analysis; at the time marked by an arrow, MBrB was added and the increase in blue fluorescence monitored with time. Gates set on scatter and PI fluorescence to observe viable, single cells. Cells prepared by Jeff Holford, then at the Institute of Cancer Research, Sutton, UK. Data file
10.6 Measurement of drug uptake
DNA is the site of action of many chemotherapeutic drugs. The uptake and retention of drugs which are fluorescent, in particular, anthracyclines such as adriamycin and daunomycin, can be measured by flow cytometry (Krishan et al., 1997). Both these dyes can be excited at 488 nm and they fluoresce orange.
There are protein complexes in the cell membrane that actively pump compounds out of the cell. These pumps act on many of the drugs used to treat cancer and over-expression of the proteins will confer resistance to a wide range of drugs giving rise to multi-drug resistance (MDR). Several proteins are involved in moving proteins from one cell compartment to another and in ejecting toxins from the cell. One of the major proteins involved, the product of the MDR1 gene, is a high molecular weight (170 kdaltons) glycoprotein located in the plasma membrane (gp170). Another important pump is operated by the protein referred to as the MDR-associated protein (MRP). Over-expression of these proteins can be detected by suitable antibodies. However, the presence of the antigen does not indicate whether the pump is active or not. Because of the complexity of the system, functional assays of the membrane pumps are often used.
The MDR pump can be inactivated by compounds, such as verapamil and cyclosporin A, which block calcium channels. In the functional assay, cells are incubated with a fluorescent compound which is acted on by the gp170 pump (for example, rhodamine 123, Hoechst 33342 or daunomycin) in the absence and the presence of either verapamil or cyclosporin A. An increase in uptake of the dye in the presence of the inhibitor indicates an MDR phenotype. The MRP pump acts on Hoechst 33342 but not rhodamine 123. It is not inhibited by cyclosporin A or verapamil . Sodium cyanide will inactivate both the MDR and the MRP pump. A typical assay for MDR is illustrated in Figure 10.4.
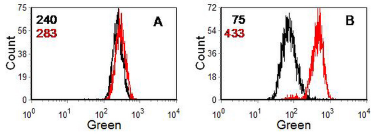
Figure 10.4. Human lymphoblastoid cell line (W1L2) incubated with 10 nM rhodamine 123. A. Parent cell line. B. Drug resistant cell line. Black: no addition; red: plus 3 µM cyclosporin A (CyA). The numbers are the median channel numbers. In the drug resistant cells, incubation with CyA increased uptake of the dye 5-fold. Data file
10.7 Chromosome analysis and sorting
Chromosome analysis and sorting is not to be undertaken lightly. A suspension of chromosomes of good quality is essential (suitable protocols have been described by Fawcett et al., 1994 and Monard and Young, 1994). Alignment of the instrument has to be undertaken with great care in order to maximise the resolution of the chromosomes. The CV of the chromosome stain should be less than 2% and, to achieve this, a laser power of several hundred mW is required. Even then, a single DNA stain which will give fluorescence proportional to the DNA content (PI, for example) will not resolve the chromosomes sufficiently. To achieve better resolution, a dual stain is used to exploit variations in the GC to AT ratio in different chromosomes. The dyes usually selected are Hoechst 33258, which shows a preference for AT-rich regions, and chromomycin A3, which binds to GC-rich regions. A cytometer with two high-powered argon-ion lasers is required; one laser is tuned to give UV to excite the Hoechst dye (blue fluorescence) and the other to 458 nm to excite the chromomycin A3 (green fluorescence). A typical result is shown in Figure 10.5. Acceptable separation between the different chromosomes is achieved with the exception of chromosomes 9-12. One way to separate these chromosomes is to use human-hamster hybrids in which only the desired chromosome amongst 9-12 is present.
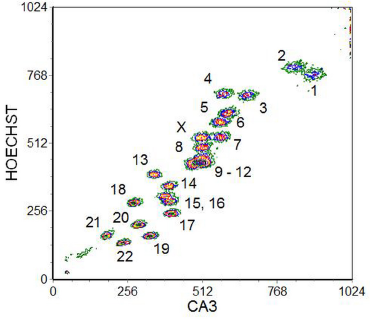
Figure 10.5. A bivariate flow karyotype of a normal human female. The chromosomes were stained with Hoechst 33258 and chromomycin A3 (CA3) and the dyes excited with UV and at 458 nm. The different chromosomes are numbered in the cytogram. Data supplied by Cordelia Langford and Nigel Carter, The Sanger Centre, Cambridge, UK. Data file

Figure 10.6. Measurement of DNA and RNA content of cultivated human peripheral blood lymphocytes stained with 7-AAD, pyronin Y and FITC-anti-CD8. The cytograms were gated on CD8 expression as indicated. A region was drawn to colour green the cells with a low RNA content (predominantly cells in G0) . After 4 days, some of the CD8 -ve cells were still in G0 (these are probably B cells). The data was recorded by Ken Toba, Nigata University School of Medicine, Japan. Data file
10.8 RNA content
Simultaneous measurement of the RNA and DNA content of cells will distinguish G0 from G1 cells and also the progress of cells through G1. DNA and RNA can be measured in permeabilised cells by labelling with acridine orange (AO) (Darzynkiewicz and Kapuscinski, 1990). Excitation is at 488 nm; the DNA-AO complexes fluoresce green and the RNA-AO red. Unfortunately the method is not simple to apply. The concentration of AO and cells used is critical and the results can also be affected by the geometry of the flow system of the cytometer.
Pyronin Y has been used to stain RNA after the binding to DNA has been blocked either with Hoechst 33342 or methyl green (Pollack et al., 1982). If a two laser instrument is available, a combination of pyronin Y and Hoechst 33342 can be used for the combined measurement of RNA and DNA (Crissman et al., 1985). Toba et al. (1995) have used a combination of pyronin Y, to stain RNA, 7-AAD, to stain DNA, and FITC-CD8 to identify a T cell subset. (Figure 10.6). Schmid et al. (2000) have improved the method and added a second antibody labelled with APC.
Reticulocytes in whole blood can be enumerated by flow cytometry by staining the RNA of unfixed cells with thiazole orange (see Chapter 7, Section 7.11).
10.9 Binding and endocytosis of ligands
The surfaces of cells are often labelled with fluorescently tagged antibodies. However, cells can be incubated with a variety of labelled ligands. If analysis is performed in the presence of different concentrations of ligand, the surface density of the receptors and an affinity constant for binding can be calculated (Fay et al., 1991; Fay et al., 1994). Cells can also be stained simultaneously with an antibody to a surface marker and a labelled ligand (Loke et al., 1992).
Receptor-ligand complexes often undergo endocytosis. Internalisation of a fluorescently-labelled ligand can be demonstrated by treating the cells with trypsin; ligand on the surface of the cell will be destroyed while internal ligand is protected. If the ligand is labelled with a pH-sensitive dye (for example, SNARF), flow cytometry can also be used to determine whether the internalised ligand enters a neutral or acidic compartment (lysosomes are acidic) (Richard et al., 2003).
10.10 Tracking cells in vivo.
Fluorescent dyes are a safe and convenient alternative to radioactive labels for following the migration of cells in vivo, particularly lymphocytes. The labelled cells are injected into an animal and are then subsequently collected (for example, by cannulation of a lymphatic duct) and counted in the flow cytometer. If required, the harvested cells can be additionally labelled with antibodies so that different populations of cells may be distinguished.
The dyes used are the same as those used to label cells for studies of cell division (see Chapter 8,Section 8.5)
Samlowski et al. (1991) and Teare et al. (1991) used an analogue of acridine orange with an N-linked 26 carbon alkyl chain (PHK26) to analyse the in vivo homing of murine lymphocytes. Another dye (CM-DiI), which has better aqueous solubility, is a chloromethyl derivative of a carbocyanine with alkyl side chains. The chloromethyl group reacts with protein thiols stabilizing the dye in the plasma membrane. The absorption maximum is 549 nm but there is sufficient absorption at 488 nm to allow the use of an argon-ion laser; it fluoresces orange. CM-DiI was used by Andrade et al. (1996) to follow the migration of labelled lymphocytes in sheep.
5-chloromethylfluorescein diacetate (CMFDA) is a tracker dye which is trapped within the cell. CMFDA diffuses freely into cells where it is converted by esterases into 5-chloromethylfluorescein. Reaction with protein thiols stabilizes the fluorescent dye in the cell. Carboxyfluorescein diacetate, succinimidyl ester (CFDA SE) also remains in the cytoplasm for several days, if not weeks, after labelling and can be used for tracker studies.
An alternative approach is to use cells into which a gene for Green Fluorescent Protein has been inserted (Bashir et al., 2008).
10.11 Monitoring electropermeabilisation
Electroporation is an efficient way of introducing foreign DNA into cells. The cells are permeabilised at a low temperature by a high voltage pulse and are then warmed to allow their membranes to reseal.
Several parameters, such as the medium used, the pulse voltage and the length and number of pulses, require optimisation. Cells also vary in their electrosensitivity. Once the other parameters have been established, the pulse voltage must be optimized for the type of cell used. A flow cytometric procedure will establish whether holes have been punched in the plasma membrane and whether they have successfully resealed (Ormerod, 1994). By also using a simple assay of cell survival, the optimum voltage can be determined (O'Hare et al., 1989).
The method is a variant of that used to estimate cell viability (Chapter 9, Section 9.2). PI is added immediately after electropermeabilisation so that cells whose membranes have been ruptured take up the dye and their nuclei fluoresce red. After the cells have been incubated in warm medium to allow their membranes to reseal, fluorescein diacetate is added so that the cells with intact membranes (either unpermeabilised or whose membranes have successfully resealed) fluoresce green (cells with a hole in their membrane will not retain fluorescein). The cells are excited at 488 nm and green versus red fluorescence is recorded. Three clusters can be identified - green positive, red negative (cells not permeabilised); green positive, red positive (cells permeabilised and resealed membrane); green negative, red positive; (cells over-permeabilised and membrane failed to reseal.
10.12 Microbead technology
Fluorescent microspheres offer a new technology involving flow cytometry. A biomolecule can be attached to a bead and its interaction with other molecules studied; for example, the binding of an antigen to an antibody (see Figure 10.7). A particularly powerful application is the use of multiplexed arrays (Nolan and Mandy, 2006). Sets of beads have been produced, each with a different fluorescent intensity and each carrying a different antibody. After incubation with a patient's serum, beads with antigens bound to their surface can be detected with fluorescein-labelled antibodies A wide range of molecules, such as hormones, cardiac markers, therapeutic drugs, drugs of abuse and blood-borne viruses, can be measured. For example, using two fluorescent dyes at ten different concentrations, a set of 100 different beads can be analysed simultaneously in a format analogous to the familiar microtitre plate, except that the whole analysis is carried out in a single tube. Using a multiwell sampler, the technology lends itself to high throughput analysis.
There are problems. The more assays contained in a single tube, the greater the possibility of cross-reactions. The different reagents need to be selected with great care. Analysis can be time-consuming unless dedicated software is used. For antibody-based assays, BD and Millipore sell kits for analysis of up to 30 analytes in a tube. Samples can be analysed either on a standard instrument or using the dedicated BD FACSArray. Luminex also produce a dedicated instrument together with 5.7 µm beads, fluorescently labelled with dyes emitting two colours in the red and infrared to give a 10x10 array. PE is used as the antibody label and a green diode laser for excitation.
The same technology can be adapted for hybridisation-based analyses for the detection of specific nucleic acid sequences. Microbead and multiplexing technology has been reviewed by Nolan and Mandy (2006); the reader will find references to a wide range of methods therein.
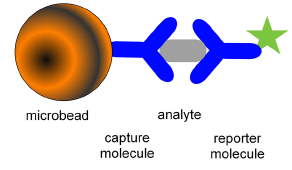
Figure 10.7. Bead capture illustrated for an antibody-based assay.
10.13 Identification of stem cells using 'side population' (SP) analysis
In human, rodent and non-human primates, stem and early progenitor cells show high expression of an ABC membrane pump. This pump will act on a variety of dyes, including the DNA binding dye, Hoechst 33342. If cells are incubated with the dye, higher concentrations of accumulate in maturer cells compared to the stem and early progenitor cells (Goodell et al., 1996, Challen and Little, 2006)). Cells are excited by UV and the blue versus red fluorescence displayed. The stem cells are found in a population which has lower fluorescence than the main population (Figure 10.8). They can be further characterised using antibodies to antigens associated stem cells, such as CD34, Sca-1 and c-kit. For cell sorting, a high power argon-ion laser tuned to emit UV is used but for analysis a variety of other light sources are suitable (Telford et al., 2004).
A similar analysis can be carried out using DyeCycle Violet (DCV) (Telford et al., 2007).
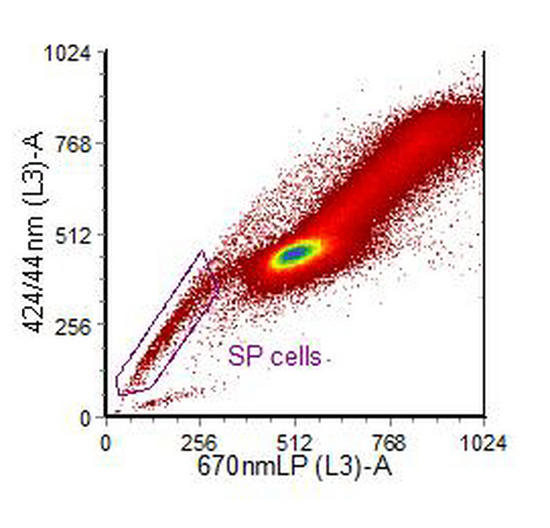
Figure 10.8. Human ovarian carcinoma cell line, IGROV1, stained with Hoechst 33342. PI was added to exclude dead cells. The cytogram was also gated on light scatter. The region has been drawn around the side population. Data supplied by Sian Rizzo, Institute of Cancer Research, Sutton, UK. Data file
10.14 References
Andrade, W., Seabrook, T.J., Johnston, M.G. and Hay, J.B. (1996) The use of the lipophilic fluorochrome CM-DiI for tracking the migration of lymphocytes. J. Immunol. Meth. 194: 181-189.
van den Brandt, J., Wang, D., Kwon, S.H., Heinkelein, M. and Reichardt, H.M. (2004) Lentivirally generated eGFP-transgenic rats allow efficient cell tracking in vivo. Genesis. 39: 94-9.
Bashir, S., Stanworth, S., Massey, E., Goddard, F., Cardigan, R. (2008) Neutrophil function is preserved in a pooled granulocyte component prepared from whole blood donations. Br. J. Haematol.140: 701-11.
Challen, G.A. and Little, M.H. (2006) A side order of stem cells: The SP phenotype. Stem Cells, 24: 3–12.
Crissman, H. A., Darzynkiewicz, Z., Tobey, R. A. and Steinkamp, J. A. (1985) Correlated measurements of DNA, RNA and protein in individual cells by flow cytometry. Science 228: 1321-1324.
Darzynkiewicz, Z. and Kapuscinski, J. (1990) Acridine orange: a versatile probe of nucleic acids and other cell constituents. In Melamed, M.R., Lindmo, T. and Mendelsohn, M.I. (eds.) Flow Cytometry and Sorting. 2nd Edition. Wiley-Liss, Inc. New York, 291-314.
Fawcett, J.J., Longmire, J.L., Martin, J.C., Deaven, L.L. and Cram, L.S. (1994) Large-scale chromosome sorting. In: Flow Cytometry. (eds. Darzynkiewicz, Z. Robinson, J.P. and Crissman, H.A.). Methods in Cell Biology, 42, pp.319-330. Academic Press, Inc., San Diego.
Fay, S.P., Habbersett, R., Domalewski, M.D., Posner, R.G., Houghton, T.G., Pierson, E., Muthukumaraswamy, N., Whitaker, J., Haugland, R.P., Freer, R.J. and Sklar, L.A. (1994) Multiparameter flow cytometric analysis of a pH sensitive formyl peptide with application to receptor structure and processing kinetics. Cytometry 15: 148-153.
Fay, S.P., Posner, R.G., Swann, W.N. and Sklar, L.A. (1991) Real-time analysis of the assembly of ligand, receptor and G protein by quantitative fluorescence flow cytometry. Biochem. 30: 5066-5075.
Goodell, M.A., Brose, K., Paradis, G., Connor, A.S. and Mulligan, A.C. (1996) Isolation and functional properties of murine hematopoietic stem cells that are replicating in vivo. J. Exp. Med.,183: 1797–1806.
Hedley, D. and Chow, S. (1994). Evaluation of methods for measuring cellular glutathione content using flow cytometry. Cytometry, 15: 349-358.
Krishan, A., Fitz, C.M. and Andritsch, I. (1997). Drug retention, efflux, and resistance in tumor cells. Cytometry 29: 279-285.
Lehmann, A. K., Sørnes, S. and Halstensen, A. (2000) Phagocytosis: measurement by flow cytometry. J Immunol Methods. 243: 229-42.
Loke, Y.W., King, A., Gardner, L. and Carter, N.P. (1992) Evidence for the expression of granulocyte-macrophage colony- stimulating factor receptors by human first trimester extravillous trophoblast and its response to cytokine. J. Reproductive Immunol. 22: 33-45.
Monard, S.P. and Young, B.D. (1994) Chromosome analysis and sorting by flow cytometry. In:Flow Cytometry. A Practical Approach. 2nd edition, (ed. Ormerod, M.G.), pp. 169-183. IRL Press at Oxford University Press, Oxford.
Nolan, J. P. and Mandy, F. (2006) Multiplexed and microparticle-based analyses: quantitative tools for the large-scale analysis of biological systems. Cytomtetry 69A: 318-325.
Pollack, A., Prudhomme, D.L., Greenstein, D.B. Irvin III, G.L., Claflin, A.J. and Block, N.L.(1982) Flow cytometric analysis of RNA content in different cell populations using pyronin Y and methyl green. Cytometry 3: 28-35.
Richard, J.P., Melikov, K., Vives, E., Ramos, C., Verbeure, B., Gait, M.J., Chernomordik, L.V. and Lebleu, B. (2003) Cell-penetrating peptides. A re-evaluation of the mechanism of cellular uptake. J Biol Chem. 278: 585-90.
Robinson, J.P., Carter, W.O. and Narayanan, P.K. (1994) Oxidative product formation analysis by flow cytometry. In: Flow Cytometry. (eds. Darzynkiewicz, Z. Robinson, J.P. and Crissman, H.A.).Methods in Cell Biology, 42, pp.437-447. Academic Press, Inc., San Diego.
Samlowski, W.E., Robertson, B.A., Draper, B.K. and Prystas, E. (1991) Effects of supravital fluorochromes used to analyze the in vivo homing of murine lymphocytes on cellular function. J. Immun. Meth. 144: 101-115.
Schmid, I., Cole, S.W., Korin, Y.D., Zack, J.A., and Giorgi, J.V. (2000) Detection of cell cycle subcompartments by flow cytometric estimation of DNA-RNA content in combination With dual-color immunofluorescence. Cytometry, 39: 118-116.
Teare, G.F., Horan, P.K., Slezak, S.E., Smith, C. and Hay, J.B. (1991) Long-tern tracking of lymphocytes in vivo: the migration of PKH-labeled lymphocytes. Cell. Immunol. 134: 157-170.
Telford, W.G. and Frolova, E.G. (2004) Discrimination of Hoechst side population in mouse bone marrow with violet and near-UV laser diodes. Cytometry A, 57: 45–52.
Telford, W.G., Bradford, J., Godfrey, W., Robey, R.W., Bates, S.E. (2007) Side population analysis using a violet-excited cell permeable DNA binding dye. Stem Cells 25:1029-1036.
Toba, K., Winton, E.F., Koike, T., and Shibita, A. (1995). Simultaneous three color analysis of the surface phenotype and DNA-RNA quantitation using 7-amino-actinomycin D and pyronin Y. J. Immunol. Meth. 182: 193-207.