Chapter 8: Cell proliferation
You are here
8.1 Introduction
There are two approaches to studying cell proliferation. One is to observe changes in the cell cycle; the other is to follow the number of cell divisions over a period of time. In the first method, at the most, three cell divisions can be followed. In the second, five or six cell divisions may be observed but no information is obtained about the cell cycle. The method is most informative when applied to lymphocytes and is generally used in the study of immune responses. It can also be combined with an immunophenotypic analysis.
A study of the cell cycle should start by obtaining cell growth and, if appropriate, cell survival data for the experimental conditions under study. The selection of relevant conditions for further work will then be possible. Next, a simple measurement of the DNA histogram (see Chapter 6) from samples harvested over time should be made. Once the characteristics of the system have been established, methods that follow the movement of cells through the cycle can be employed. Two methods are described in this chapter, both of which involve labelling the cells with 5’-bromodeoxyuridine (BrdUrd), which is incorporated into the DNA in place of thymidine.
8.2 Using the DNA histogram to observe effects on proliferation
The DNA histogram gives a static picture of the proportion of cells in different phases of the cell cycle. Despite this limitation, histograms measured at different times after treatment, for example with drugs or radiation, can yield a wealth of information. Figure 8.1 shows DNA histograms recorded at different times after incubation of cells with a platinum dicarboxylate (Ormerod et al., 1996). This is the same data that was used to illustrate cell cycle analysis in Figure 6.9. There was a block in G2/M of the cell cycle, observed at 16 hours. The normal cell cycle time of these cells was about 13 hours. After incubation with the drug, the cells took between 16 and 24 hours to reach G2; there was a slow down in progression through S phase. At 24 hours, there were still an appreciable number of cells in G1 and S phases. These data cannot tell us whether some or all of these cells are proliferating although the DNA histogram recorded at 48 h suggest that they are (Figure 6.10). To be certain, we need to use other methods, such as those described below.

Figure 8.1. Cells from murine leukaemic cell line, L1210, at different times(marked in hours) after incubation with a Pt dicarboxylate. Cells fixed in 70% ethanol; PI stain. Data file
In Figure 8.2, the cells had been incubated with imatinib (Glivec). The number of cells in G1 had increased with a corresponding decrease in the numbers in S and G2/M, indicating an arrest in G1. In the other example (Figure 8.3), the cells were incubated with an anti-folate which blocks synthesis of thymidine and hence DNA synthesis. The cells in G2/M were unaffected and have divided resulting in an absence of the G2/M peak. There has been a slight movement of cells from G1 into early S phase.
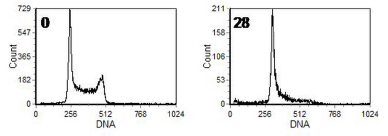
Figure 8.2. Human CML cell line, K562, before (0) and 28 h after addition of imatinib. Cells fixed in formalin followed by methanol. PI stain. Cells prepared by Vincent Shankey, Beckman Coulter, Miami. Data file
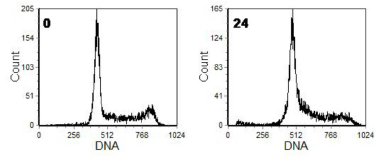
Figure 8.3. Human ovarian carcinoma cell line, KB, at the times shown in hours after addition of an anti-folate. Cells fixed in 70% ethanol. PI stain. Cells prepared by Matthew Green, Institute of Cancer Research, Sutton, UK.Data file
8.3 The BrdUrd/anti-BrdUrd method
8.3.1 Introduction
If cells are pulse-labelled with BrdUrd, those cells that are in S phase at the time of labelling will have incorporated the precursor into their DNA and can be detected by an antibody to BrdUrd. Antibody labelling is correlated with the DNA histogram by the addition of PI. By incubation of the cells in growth conditions after labelling, the subsequent movement of the labelled cells around the cycle can be followed.
Unfortunately, antibodies are not able to react with BrdUrd incorporated into DNA unless the structure of the chromatin is first disrupted. Disruption can be achieved by treatment with strong acid, heat or formamide or by controlled digestion with a nuclease. Suitable protocols have been given by Wilson (2000). Care must be taken during the denaturation step since excessive treatment can adversely affect the DNA histogram.
The use of a harsh treatment to disrupt the DNA can make a study of cell kinetics combined with measurement of an antigen difficult. If this is desired, the most reliable procedure is to use a nuclease in the denaturation step. If FITC and PE are used to label the two antibodies, then 7-AAD, DRAQ5, PI plus TO-PRO-1 or, if UV is available, DAPI should be used to stain the DNA (see Chapter 6). All the BrdUrd data shown below used strong acid to disrupt the DNA. An example of a BrdUrd stain using a nuclease is given here.
Instead of bromo-deoxyuridine, chloro- or iodo-deoxyuridine, with a suitable antibody, may be used. Some monoclonal antibodies show specificity for just one of the halogeno-pyrimidines so that additional information can be gained by pulse-labelling at a later time with a second precursor. This approach allows two time points to be obtained from a single sample, which could be useful for clinical studies on human tumours in vivo.
Recently, Invitrogen have introduced a new method based on 5-ethynyl-2’-deoxyuridine (EDU), which is incorporated into the DNA in place of thymidine. Detection relies on a copper catalysed covalent reaction between an azide and an alkyne, the so-called click reaction. EDU is an alkyne and Invitrogen supply either Alexa 488, Alexa Fluor 647 or Pacific Blue as an azide. The advantage to this method is that the fluorescent azide, because of its small size, can penetrate the chromatin and access the EDU - denaturation of the DNA is not required. An example of this stain is given here.
8.3.2 Data from cultured cells
Figure 8.4 shows data from a normally cycling cell line (Chinese hamster V79). Immediately after incubation BrdUrd had been taken up by the cells in S phase; G and G2/M phases are unlabelled. Two hours later, there were few unlabelled cells in G2/M; most of them had divided and were in G1. Movement of the labelled cells through S phase is apparent. By four hours, some of the labelled cells had moved through G2, divided and were in G1; note the reduction in green fluorescence as the label was divided between the daughter cells. The rest of the labelled cells were in G2 and mid to late S phase. Unlabelled cells, originally in G1, were now progressing through S phase. At six hours, most of the cells in S phase were unlabelled and the labelled cells were all in G1 and G2/M. After 8 h, labelled cells were again moving into S phase.
A simple visual inspection of the data shows that the cell cycle time for these cells was about 11 h, at which time the original pattern would have been approximately re-established. An alternative method of analysis is to place a window in the part of the cell cycle (for example, in the centre of S phase) and to measure the rate of transit of labelled cells through the window (Figure 8.5). This method is equivalent to that of pulse labelled mitoses (plm) in which cells are pulse labelled with tritiated thymidine, fixed for autoradiography at later times and the percentage of labelled mitoses versus time is recorded.

Figure 8.4. Chinese hamster, V79, cells were incubated in suspension culture for 30 min with 10 µM BrdUrd. The cells were washed and incubated further at 37°C for the times in hours indicated, after which the cells were harvested and fixed in 70% ethanol. They were washed in PBS and their DNA disrupted by incubation in 2M HCl at room temperature for 30 min. After washing to remove acid, they were incubated with a rat monoclonal anti-BrdUrd antibody, followed by incubation with FITC-labelled rabbit anti-rat Ig and PI added. Data supplied by George D. Wilson, then at the CRC Gray Laboratories, Northwood, UK. Data file

Figure 8.5. Movement of labelled cells through a window set in the centre of S phase.
There are two approaches to observing the effects of a treatment, such as a drug or radiation. The cells can be pulse-labelled, the treatment applied and samples taken with time. This method shows the progression of the cells that were in S phase at the time of
treatment. Alternatively, the cells can be pulse-labelled at different times after treatment, which will show the behaviour of the cells which are in S phase at that particular time.
The first method is illustrated in Figure 8.6. The data were given to me by George Wilson. I have described the interpretation in some detail because it illustrates the wealth of data that can be derived from a simple experiment. The appearance of the data in these plots is different to Figure 8.4because the green (anti-BrdUrd) fluorescence was recorded on a logarithmic scale.

Figure 8.6. Chinese Hamster, V79, cells treated as described in Figure 8.4. One sample of cells was given 2 Gray ɣ radiation immediately after labelling. Samples were taken at the times indicated. The features indicated by lower case letters, a ... h, are discussed in the text. Data supplied by George D. Wilson, then at the CRC Gray Laboratories, Northwood, UK.
At 6 hours, the irradiated cells showed a block in G2/M (a) with a corresponding lack of labelled cells in G1 compared to the control (c). Cells were progressing through S phase, both labelled and unlabelled (b). At 12 hours, in the control sample, some of the labelled cells had divided, moved through G1 and were re-entering S phase (d) but there were unlabelled cells in G1 that had still to move into S phase, illustrating the heterogeneity of the cell cycle. In the irradiated sample, the labelled cells were in G1 (f) and G2/M (g); between 12 and 6 hours, some of the cells had overcome the block at G2/M and divided. There were few unlabelled cells in S phase (h). Presumably the cells that were past the check point in G1 at the time of irradiation were able to continue around the cell cycle and populated S phase by 6 hours (b) but those prior to the check point were unable to proceed.
Figure 8.7 shows an experiment to investigate the behaviours of a cell line 24 hours after addition of a drug, cis-platin. Cells were synthesising DNA at a far slower rate than untreated cells. The mean BrdUrd channel was only 140 compared to 1100 in the control. Some cells with an S phase DNA content have stopped making DNA.
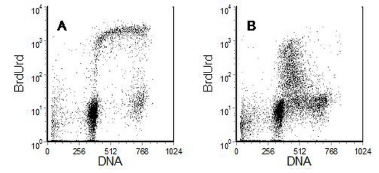
Figure 8.7. Human neuroblastoma cell line. A, control cells; B Cis-platin added 24 hours before pulse-labelling with BrdUrd. Cells harvested immediately after the incubation with BrdUrd. Data recorded during the Royal Microscopical Society’s Flow Cytometry Course, Sheffield, 2001. Data file
8.3.3 Data from tumours in vivo
BrdUrd has a half-life of about 20 minutes in the blood. Consequently, injecting BrdUrd into an animal will deliver a pulse-label to any proliferating cells. This has enabled the BrdUrd method to be applied to tumours growing in an animal or, indeed, a human being.
At a fixed time after injection of the label, tumour cells are collected either by biopsy or by killing the animal. Tissue fragments are fixed in ethanol and subsequently incubated with pepsin/0.1 M HCl to release the nuclei. The labelling method follows the same procedure as with cultured cells. Typical data are shown in Figure 8.8.

Figure 8.8. A rat mammary tumour. The rat was injected with BrdUrd 4 hours before the tumour was excised. Further details in the text. Cells prepared by Tim Smith, Royal Marsden NHS Trust, Sutton, and the sample analysed by Jenny Titley, Institute of Cancer Research, Sutton. Data file
In Figure 8.8, showing data from a rat mammary tumour, D marks the position of the normal diploid cells. The tumour was aneuploid; the cell cycle phases are marked. The tumour was excised 4 hours after the injection of BrdUrd. During that time some of the labelled cells had moved through G2/M and divided. From the gap between G1 and the position of the cells that were labelled in early S phase (arrowed), the S phase transit time can be calculated (Begg et al., 1985). This approach can also be used with human tumours. Although several studies have looked for a correlation between the cell cycle characteristics and the response of tumours to radiotherapy, the method has turned out to be of little clinical value.
Figure 8.9 shows the effect of the drugs, paclitaxel and cis-platin, on cell proliferation in a human tumour xenografted into immune deprived mice. The residual mouse stromal cells (in G1) in the tumour have been coloured blue and are arrowed. Treatment with paclitaxel did not affect the movement of cells through S phase but there was an absence of labelled cells in G1, indicating a block in G2/M, as has been observed in cell cultures. The major effect of cis-platin treatment was a dramatic slow down in the movement of cells through S phase, similar to that observed in Figure 8.7 with cultured cells. In view of the large literature reporting on the effects of various drugs on cells in culture, it is reassuring to be able to observe similar effects on cells in vivo.

Figure 8.9. Xenografted human ovarian carcinoma. 24 hours after injection of the drug, BrdUrd was injected and the mice killed 6 hours later. Samples prepared as described in the text for Figure 8.8. A: No drug, B: paclitaxel and C: cis-platin. Cells prepared by Mansour Al-Moundhri and data recorded by Jenny Titley, Institute of Cancer Research, Sutton, UK. Data file
8.4 The BrdUrd/Hoechst/PI method
8.4.1 Introduction
Some of the bis-benzimidazole dyes are usually referred to by the name of the original manufacturer, Hoechst. Hoechst 33342 and Hoechst 33258 bind to AT rich regions in DNA and fluoresce blue under UV. The fluorescence is quenched if BrdUrd is incorporated into the DNA in place of thymidine. Consequently continuous labelling with BrdUrd and subsequent staining of DNA with Hoechst 33258 separates cells according to the number of replications they underwent during the period of labelling. Addition of a DNA label unaffected by BrdUrd, such as PI, resolves the cell cycle into the G0/G1, S and G2/M compartments (Rabinovitch et al., 1988). In this method, cultured cells are incubated with BrdUrd for different times, the cells harvested, nuclei prepared by lysis with a detergent and stained by the addition of Hoechst 33258 and either PI or ethidium bromide (EB). In the flow cytometer, the cells are excited with UV light and red (PI-DNA) versus blue (Hoechst-DNA) fluorescence is recorded.
Many studies have reported the analysis of the rate of exit from the G0/G1 compartment of the cell cycle using synchronised cells (Poot et al., 1990). The method is not limited to synchronous cells and it has also been used to analyse cell cycle progression in asynchronous cultures (Ormerod and Kubbies, 1992). Both applications are described in this section.
Experimental protocols have been given by Poot and Ormerod (1994).
8.4.2 Synchronised cells
These experiments generally use either naturally quiescent lymphocytes from peripheral blood, spleen or thymus or cultured cells rendered quiescent by reduction of growth factors (frequently fibroblasts cultured in the absence of serum). The BrdUrd is added at
the same time as a factor which will stimulate the cells into cycle, for example, phytohemaglutinin (PHA) for lymphocytes or serum for fibroblasts. If a cytotoxic agent is being studied, the drug is usually also added at the start of the experiment. Sufficient information can usually be gained at a single time point, for lymphocytes, typically 72 hours.
Figure 8.10 shows a dot plot obtained from human peripheral blood lymphocytes 72 hours after stimulation with PHA. There is a cluster of cells that remained quiescent and had not left G0/G1. If BrdUrd had not been added, as the cells started cycling, both the blue and the red fluorescence would have increased (arrowed). The presence of BrdUrd quenches the blue fluorescence giving the first cell cycle, as shown (coloured blue). PI is excited directly by UV but there is also a component of its fluorescence resulting from energy transfer from the Hoechst 33528 so that there is some reduction in the red fluorescence when the blue is quenched. This could be avoided by using a second, blue or green, laser. The G1' cluster are cells which have divided once. Cell division caused halving of the fluorescence intensity of the cell in the first G2 in both the Hoechst and PI direction. The track from cells in the second cycle (coloured yellow) moved to the right because there was less quenching on the second round of labelling. A cluster of cells which had divided twice (G1'') can be resolved together with a few cells which have moved into S phase (green). The red dots are from dying and fragmented cells.

Figure 8.10. The BrdUrd-Hoechst/PI method applied to synchronised cells. A cytogram of red (PI) versus blue (Hoechst) fluorescence from human peripheral blood lymphocytes 72 h after stimulation with PHA and simultaneous addition of 80 µM BrdUrd. After 72 h, the cells were suspended in a buffer containing detergent to release the nuclei, Hoechst 33258 and PI. Data file
8.4.3 Asynchronous cells
BrdUrd is normally added to cultures (suspension or adherent) of cells which have been established in the early stages of exponential growth. If the effects of radiation (high energy, UV or heat) are to be studied, the cultures are treated before adding BrdUrd. Short term drug treatments are also carried out before adding BrdUrd; for continuous treatment with a cytotoxic drug, the compound is normally added with the BrdUrd. Extra information about the proliferative fate of the cells can sometimes be obtained by adding the BrdUrd some time after the drug (Ormerod et al., 1994; Skelton et al., 1998). The following figures show how details of the effects of radiation or drugs can be elucidated using this method. At time 0, the profile obtained will be as shown in Figure 8.11 both the blue (Hoechst) and the red (PI) fluorescence showing G1, S and G2/M of the cell cycle. As BrdUrd is taken up into the DNA, if the concentration has been chosen correctly, the pattern will change indicated by the arrows. The cells in G2 will divide and move to G1; the cells moving into and through S will show an increase in red but no change in blue fluorescence.

Figure 8.11 Nuclei stained with Hoechst 33258 and PI. The arrows indicate the expected changes when the cells are first incubated with BrdUrd. Cells prepared by David Gilligan and data recorded by Jenny Titley, Institute of Cancer Research, Sutton, UK (Gilligan et al., 1996). Data file
Figure 8.12 shows the changes observed during BrdUrd uptake. At 16 hours, most of the cells that started in S phase are now in G2/M (G2*); a few have divided and are in G1 (arrowed). S phase (Sf) is populated with cells that started in G1 and some have reached G2/M (G2f). At 28 hours, the majority of the cells that started in S have divided as have some the cells that started in G1 to form the cluster G1’. Comparing G2f and G2* shows that there is some reduction in PI fluorescence. For an explanation, see Section 8.4.2.

Figure 8.12. Human embryonic fibroblast cell line incubated with BrdUrd for the times (in hours) indicated on the panels. For further explanation, see text. Cells prepared by David Gilligan and data recorded by Jenny Titley, Institute of Cancer Research, Sutton, UK. Data file
G2 arrest caused by ɣ-radiation is shown in Figure 8.13. While a few cells have divided (arrowed), the majority of them are blocked in G2. The phase of the cycle in which the cells were at the time of irradiation is indicated. These cells had mutated p53 and hence no G1 checkpoint control.
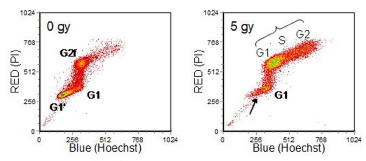
Figure 8.13. Human embryonic fibroblast cell line incubated with BrdUrd for 28 hours, ɣ radiation dose indicated on the panels. For
further explanation, see text. Cells prepared by David Gilligan and data recorded by Jenny Titley, Institute of Cancer. Research,Sutton, UK. Data file
Figure 8.14 contains data from cells with wild-type p53. Radiation caused a block in G1 Those cells which were in advance of the G1 check point completed a round of replication before the block. The percentage of cells in the two G1 compartments are given in the Tables. These data parallel those inFigure 8.6; an explanation is given in the text associated with that figure.

Figure 8.14. Human cervical carcinoma cell line incubated with BrdUrd for 28 hours, ɣ radiation dose indicated on the panels. For
further explanation, see text. Cells prepared by C Bush and data recorded by Jenny Titley, Institute of Cancer Research, Sutton, UK. Data file
The final figure is this section has data from cells incubated with cis-platin. There is a block in G2/M evident but unlike that observed after ɣ-irradiation, only the cells in G1 or early S phase at the time of treatment are in G2 (G2f), the other cells have divided.
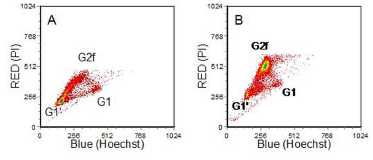
Figure 8.15. Human lymphoblastoid cell line incubated with cis-platin for 2 hours before addition of BrdUrd and incubation for 24 hours. A. No drug; B. 4 µM cis-platin. (Ormerod et al., 1994). Data file
8.5 The dye dilution method
If a fluorescent label is firmly attached to a cell, when the cell divides, the label will be shared equally between the two daughter cells. The number of cell divisions can be determined by following the dilution of the label as the cells divide. Two compounds have been used for this application - carboxyfluorescein diacetate, succinimidyl ester (CFDA-SE) and PHK26, an analogue of acridine orange with an N-linked 26 carbon alkyl chain. Because of its long alkyl side chain, PHK26 becomes anchored in the plasma membrane of cells. CFDA-SE diffuses into cells wherein it is converted to carboxyfluorescein succinimidyl ester; its reaction with amines stabilizes the fluorescent product in the cell. The method is best applied to resting lymphocytes before activation. These cells are homogeneous so that the fluorescent cells have a CV low enough to be able to resolve the different number of divisions. Cultured cells are more heterogeneous and the lack of resolution of the rounds of division makes interpretation of the data difficult. When working with lymphocytes, their immunophenotype can be identified by the addition of appropriate antibodies (Lyons 2000, Wallaceet al., 2008).
In the example shown in Figure 8.16, murine CD4+ lymphocytes, labelled with CDFA-SE were cultured with antigen-presenting cells with different peptides to stimulate either the memory or the memory and naïve cells. Up to five cell divisions can be observed.
Recently, Invitrogen have introduced a new dye which they have called Cell Trace Violet. It is functionally similar to CFDA-SE but is excited by a violet laser (405 nm) and fluoresces at 490 nm.
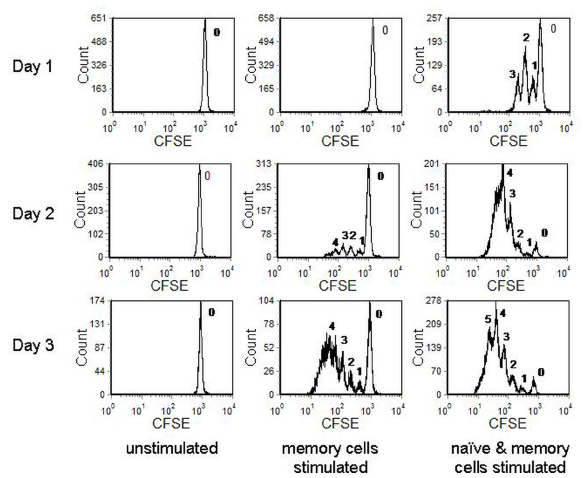
Figure 8.16. CDFA-SE labelled murine lymphocytes incubated under different conditions. The cells were labelled at day -1 and stimulated on day 0; cells were harvested at different times as shown. The numbers label the number of cell divisions undergone by the different populations. Data from Maria Daley, then working at Glaxo-Wellcome. Data file
8.6 References
Begg, A.C., McNally, N.J., Shrieve, D.C. and Karcher, H. (1985) A method to measure the duration of DNA synthesis and potential doubling time from a single sample. Cytometry 6: 620-626.
Gilligan D., Mort C., McMillan T. J., Peacock J. H., Titley J. and Ormerod M.G. (1996) Application of a bromodeoxyuridine-Hoechst/ethidium bromide technique for the analysis of radiation-induced cell cycle delays in asynchronous populations. Int. J. Rad. Biol. 69: 251-257.
Lyons A.B. (2000) Analysing cell division in vivo and in vitro using flow cytometric measurement of CFSE dye dilution. J. Immunol. Methods 243:147-154.
Ormerod, M.G., and Kubbies, M. (1992) Cell cycle analysis of asynchronous populations by flow cytometry using bromodeoxyuridine label and Hoechst-propidium iodide stain. Cytometry 13: 678-685.
Ormerod, M.G., Orr, R.M., O'Neill, C.F., Chwalinski, T, Titley, JC, Kelland, L.R. and Harrap, K.R. (1996) The cytotoxic action of four ammine/amine platinum (IV) dicarboxylates: a flow cytometric study. Brit. J. Cancer 74: 1935-1943.
Ormerod, M.G., Orr, R.M. and Peacock, J.H. (1994) The role of apoptosis in cell killing by cisplatin: a flow cytometric study. Brit. J. Cancer 69: 93-100.
Poot, M. and Ormerod, M.G. (1994) Analysis of cell proliferation using continuous bromodeoxyuridine labeling and bivariate Hoechst 33258/ethidium bromide flow cytometry. In: Flow Cytometry. A Practical Approach. (ed. Ormerod, M.G.) 2nd Edn. pp. 157-167. IRL Press at Oxford University Press, Oxford.
Poot, M., Hoehn, H., Kubbies, M., Grossman, A., Chen, Y. and Rabinovitch, P.S. (1994) Cell cycle analysis using continuous bromodeoxyuridine labeling and Hoechst 33258-ethidium bromide bivariate flow cytometry. In: Flow Cytometry. (eds.
Darzynkiewicz, Z., Robinson, J.P. and Crissman, H. A.). Methods in Cell Biology 41, pp. 327-340. Academic Press, New York.
Rabinovitch, P.S., Kubbies, M., Chen, Y.C., Schindler, D. and Hoehn, H. (1988) BrdUrd-Hoechst flow cytometry. A unique tool for quantitative cell cycle analysis. Exp. Cell Res. 174: 309-318.
Skelton, L.A., Ormerod, M.G., Titley, J.C. and Jackson, A.L. (1998) Cell cycle effects of CB30865, a lipophilic quinazoline-based analogue of the antifolate thymidylate synthase inhibitor ICIn 198583 with an undefined mechanism of action. Cytometry 33: 55-66.
Wallace, P.K., Tario, J.D., Fisher, I.L., Wallace, S.S., Ernstoff, S.S. And Muirhead, K.A.(2008) Tracking antigen-driven responses by flow cytometry: monitoring proliferation by dye dilution. Cytometry 73: 1019-1034.
Wilson G.D. (2000). Analysis of DNA - measurement of cell kinetics by the bromodeoxyuridine/anti-bromodeoxyuridine method. In Flow Cytometry. A Practical Approach. Ormerod, M.G. (ed). 3rd edition. Oxford University Press, Oxford. 83-97