Chapter 7: Some Clinical Applications
You are here
7.1 Introduction
Flow cytometry is finding increasing use in routine clinical laboratories for the diagnosis, prognosis and monitoring of disease. Some of the applications in widespread use are described below, together with some comments on quality control. Other applications, such as the measurement of DNA ploidy and the cell cycle (Chapter 6), and the measurement of oxidative burst in granulocytes (Chapter 10,Section 10.2) will be found elsewhere. With the exception of reticulocyte analysis, all these applications involve the measurement of proteins in or on cells using immunofluorescence (Chapter 5).
7.2 Analysis of leukaemias and lymphomas
Immunophenotyping by flow cytometry is an important tool in the diagnosis and staging of patients with a haematological neoplasm. It is used in conjunction with classical morphology.
In the bone marrow, normal blood cells develop from stem cells in a progressive series of differentiations, branching off to give different lineages of cells (for example, myeloid or lymphoid, T cell or B cell), each of which has a distinct maturation pathway. At each stage, the cells carry a distinctive set of markers classified by the CD (cluster of differentiation) nomenclature. Malignancies can arise at different stages in the development of a cell. A leukaemia or lymphoma will express a specific set of markers depending on the stage and pathway of differentiation and they are classified accordingly (see, for example, Qadir et al.. 2006, and references therein). Leukaemias may, however, lack certain markers or express aberrant proteins; there are even biphenotypic leukaemias.
The initial evaluation is made with a panel of antibodies usually using them in three or more colour combinations. The panel selected will depend on initial clinical diagnosis. The results from the initial screen may indicate the need for further classification with an extended panel that is more specific for a particular disease. The basic markers include:
B cell: CD5, CD10, CD19, CD20, CD45, Kappa, Lambda;
T cell: CD2, CD3, CD4, CD5, CD7, CD8, CD45, CD56;
Myelomonocytic: CD7, CD11b, CD13, CD14, CD15, CD16, CD33, CD34, CD45, CD56, CD117, HLA-DR;
Plasma cell: CD19, CD38, CD45, CD56, CD138.
CD45 is expressed by all leucocytes and a plot of SS versus CD45 generally gives a good estimate of the most important leucocyte sub-types. If four or more colours are measured, it is customary to include CD45 as one of the colours in every tube.
There have been several review articles and consensus reports on this topic, see, for example, Craig and Foon, 2008, and Wood et al., 2007. Examples of analysis of leukaemias can be found athttp://wiki.clinicalflow.com.
7.3 Detection of minimal residual disease
Minimal residual disease (MRD) was defined as disease beyond the limit of morphological detection using conventional microscopy. Patients with acute leukaemia were considered to be in remission when bone marrow samples contained <5% neoplastic cells. Flow cytometric methods can detect far lower levels of disease, which can be important in the clinical management of leukaemia. The residual tumour cells are detected using immunofluorescence of surface markers. A panel of at least three antibodies is used, the antibodies being selected on the basis of the immunophenotype of the original leukaemia.
An example is shown in Figure 7.1. Campana and Coustan-Smith (2004) and Kern et al. (2008) have reviewed the methods for studying MRD in leukaemia.
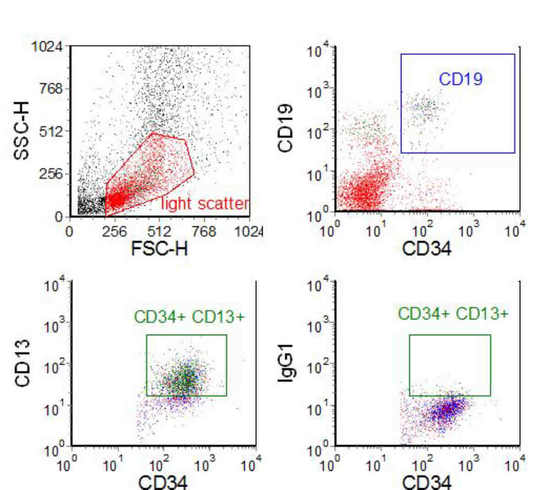
Figure 7.1. A bone marrow sample from a child with acute lymphoblastic leukaemia (ALL) undergoing treatment and considered to be in clinical and morphological remission. Mononucleated cells were separated on a density gradient and labelled with three antibodies associated with the phenotype of the leukaemia - CD19/CD34/CD13. One sample had an isotype control in place of the CD13 antibody. The CD13 versus CD34 plot was gated on light scatter and the CD19, CD34 +ve cluster. 110,000 events were recorded; there were 62 cells in the region set on the isotype control and 2021 cells in the same region set on the positive sample. Data supplied by Dario Campana, St. Jude’s Hospital, Memphis. Data file
Comments on the number of cells which should be recorded and the statistical significance of the results can be found in Chapter 4, Section 4.5. These comments also apply to Sections 7.4, 7.8 and7.12.
7.4 Stem cell enumeration
Haemopoietic stem cells in the bone marrow can be identified by their expression of CD34. Normally, the number of such cells in bone marrow is low and is negligible in peripheral blood. However, if mobilisation of CD34 positive cells from the bone marrow is stimulated, stem cells can be harvested from the peripheral blood as well as the marrow. These cells can be used to repopulate a depleted bone marrow after, for example, high dose chemotherapy.
To assist in the identification of a small percentage of CD34 positive cells, a double stain of CD34 and CD45 is used. The method gives the percentage of CD34 +ve cells. To obtain the absolute CD34+ concentration, the total cell concentration is counted in a haematology analyser (two-platform method). The whole procedure can be performed on a flow cytometer (single platform) by spiking the sample with a known number of fluorescent beads, which will enable the volume of blood analysed to be calculated (Keeney et al. 1998) (see Chapter 4, Section 4.2.2). The issues involved in the analysis have been discussed by Gratama et al. (1998).
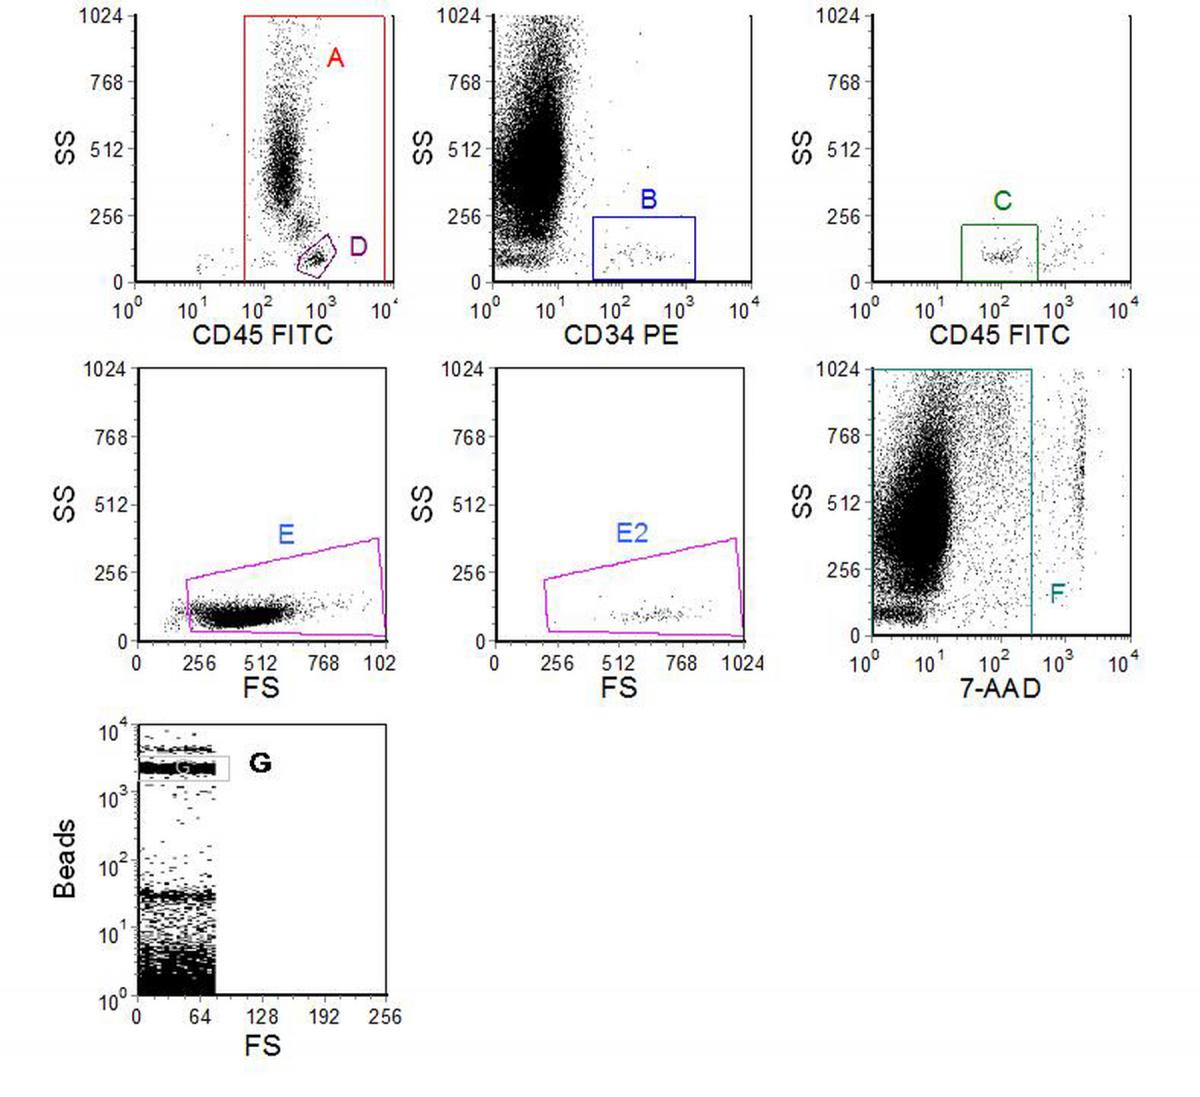
Figure 7.2. Enumeration of CD34 +ve cells in peripheral blood. Cells were labelled using a no-wash protocol with CD45-FITC and CD34-PE. Before analysis, 7-AAD was added. Fluorescent beads were added to the undiluted blood to give 102 beads per µl. Data supplied by Mike Keeney, London Health Sciences Centre, Ontario, Canada. Data file
Figure 7.2 shows an example of CD34 enumeration using a protocol which follows the ISHAGE guidelines (Sutherland et al., 1977). The region, A, was set on a cytogram of SS versus CD45 to delineate the leucocytes. Region B was set to enclose the CD34 +ve cells. Region C to include the weakly positive CD45 cells was set on a dot plot of SS versus CD45 gated on (A AND B). Region D was drawn around the lymphocytes on the SS versus CD45 plot and used to gate a plot of SS versus FS. Region E was drawn to include all the lymphocytes and this region was copied onto another scatter plot gated on (A AND B AND C), (E2). Region F was drawn on a dotplot of SS versus 7-AAD to exclude the 7-AAD positive cells (dead) and all the previous plots gated on this region. The cells in region E2 were then recorded as the CD34 +ve cells. The region G was drawn around the single beads on a separate plot. 2758 beads and 96 CD34 +ve cells were recorded giving 3.5 CD34 +ve cells/µl. A total of 261,398 viable leucocytes were analysed but this figure does not enter into the final calculation.
Further examples of CD34 quantitation can be found atwww.denovosoftware.com/site/Publishing.shtml.
7.5 Solid organ transplantation
7.5.1 T cell cross-match
Flow cytometry can be used to crossmatch a recipient's serum with donor lymphocytes to detect antibodies that could interfere with engraftment (Bell et al., 1998). Prior to organ transplantation, the organ donor's lymphocytes are incubated with serum from the potential recipient of the graft. After washing, bound immunoglobulins are detected using an FITC-conjugated anti-human IgG antibody. The T cells are identified using a PE-CD3 conjugate.
7.5.2 Postoperative monitoring
After the organ transplant, analysis of the peripheral blood lymphocytes may help to indicate early rejection and bone marrow toxicity during immunosuppressive therapies, and to help in the differentiation of infections from transplant rejection (Shanahan, 1997). A variety of cell surface markers and activation antigens can be used depending on the clinical condition and the organ transplanted.
Peripheral blood testing may also be used to monitor the effectiveness of anti-rejection immunosuppressive therapy, which may include, for example, antibodies designed to destroy T cells. The number of circulating T-cells is usually determined by measuring the cell surface marker CD3.
7.6 Detection of autoantibodies
Autoantibodies to leucocytes, platelets and erythrocytes may be found in a variety of autoimmune conditions and can cause anaemia, leukopenia, or thrombocytopenia. They are detected by immunofluorescence in either a direct or an indirect assay. In the former, anti-human Ig antibodies are used to detect Ig on the surface of the patient’s cells. In the indirect assay, the reaction of antibodies in the patient’s serum with cells from a normal person is observed. The procedures are similar to those used for a T cell crossmatch (see Section 7.5.1).
7.7 HIV infection.
Determination of the numbers of CD4 +ve lymphocytes in the peripheral blood is used to monitor patients with HIV infections (Mandy et al., 2002). The percentage of CD4 +ve cells can be obtained in a single tube by staining for CD45/CD3/CD4. A cytogram of SS versus CD45 is used to identify the lymphocytes and a cytogram of CD4 versus CD3 to enumerate the CD4+ve T cells. An extended panel is used to obtain a more complete picture of the peripheral blood lymphocytes.
The absolute number of CD4 +ve cells is the clinically relevant parameter; see Chapter 4, Section 4.4.2 for a discussion on counting cells.
Recently, there has been a focus on developing a simplified method using a low cost cytometer suitable for developing countries, particularly those in Africa where there is a high incidence of HIV infection (Mandy et al., 2008).
7.8 Foeto-maternal haemorrhage
Foeto-maternal bleeding can sensitise a Rhesus blood group D-ve mother to D+ve blood cells from the foetus. In a subsequent pregnancy, haemolytic disease of the new born child can be caused by the destruction of Rhesus D +ve blood cells of the foetus by maternal anti-D antibodies. Prophylactic anti-D given to the Rhesus D -ve mother shortly after delivery of a Rhesus D +ve child significantly reduces the incidence of anti-D sensitisation in the mother and has led to the virtual elimination of the disease from mothers so treated. Since the dose of anti-D given is related to the size of the foeto-maternal haemorrhage, quantitation of foetal-maternal haemorrhage is therefore important.
Quantitation is achieved by labelling the erythrocytes in a sample of maternal blood with FITC-conjugated, non-agglutinating anti-D antibodies (Nance et al., 1989). A population of as few as 0.1% foetal cells is sufficient to sensitise the parent so at least 500,000 cells should be analysed to obtain a statistically significant estimation.
7.9 Immunodeficiency diseases
Diseases resulting from primary immunodeficiencies, which are usually found in infants and young children, can be a result of defects in T-cells, B-cells, granulocytes or monocytes. In many of these diseases surface or cytoplasmic proteins are missing or have impaired function. They are characterized by immunophenotyping, the selection of antibodies being based on the clinical presentation.
Flow cytometry can also be used to detect functional abnormalities in leucocytes. Possible functional tests include the analysis of oxidative burst and phagocytic function in granulocytes and monocytes (see Chapter 10, Section 10.2), T and B cell mitogen responses, NK cell tumour cell lytic function and platelet activation antigens.
Secondary immunodeficiencies are caused by another illness, condition, medical treatment or intervention, the patient presenting with frequent and often atypical infections. Some of the conditions and diseases which can cause immunodeficiencies are severe malnutrition, biotin, B12 or zinc deficiency, lymphoma, myasthenia gravis, myeloma, radiation or chemotherapy, chronic alcoholism, drug abuse, cancer, splenectomy and chronic viral illnesses. If a secondary immunodeficiency is suspected, the immune status can be assessed by analysing the peripheral blood lymphocytes. The panel of markers might include CD3, CD4 and CD8 (to assess T cells), CD19 (for B cells), CD56 (NK cells) and, after incubation with a mitogen such as PHA, either HLA-DR or CD69 (to assess lymphocyte activation).
7.10 Paroxysmal nocturnal haemoglobinuria
Paroxysmal nocturnal haemoglobinuria (PNH) is an acquired disease characterised by the development of an abnormal clone of precursor cells in the bone marrow. The white cells and red cells produced are dysfunctional and are susceptible to lysis. Analysis of this clonal abnormality by flow cytometry, in general, can be accomplished by analysis of CD55 and CD59 on red cells (Richards et al., 2000).
7.11 Reticulocyte analysis
Reticulocytes can be distinguished from erythrocytes by their high content of RNA. There are several stains that can be used for RNA, one of them is thiazole orange (Davis and Bigelow, 1994). A typical result is shown in Figure 7.3.
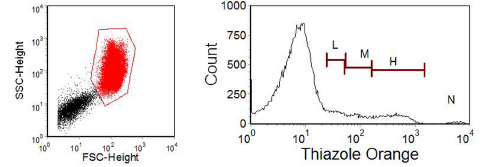
Figure 7.3. Thiazole staining of red cells in peripheral blood with a high concentration of reticulocytes. A region has been drawn on the red cells in the scatter plot; note the logarithmic scale. The other major cluster in the scatter plot are the platelets. The histogram was gated on the red cells and the regions on it delineate cells with high (H), medium (M) and low (L) fluorescence corresponding to increasing reticulocyte maturity. N marks nucleated red cells. Data supplied by Terry Hoy, then at the University of Wales College of Medicine, Cardiff. Data file
7.12 Some other applications in blood transfusion
For reviews on this topic, see Garratty and Ardnt (1995), Garratty (1999) and Freedman and Lazarus (1995).
7.12.1 Contaminating leucocytes
The presence of contaminating leukocytes in transfused products of blood may cause a number of adverse effects. These include:
• nonhaemolytic febrile reactions
• graft-versus-host disease
• cytomegalovirus transmission
• pulmonary oedema
• alloimmunization to HLA class I antigens
Flow cytometry offers a sensitive measure of the number of remaining leucocytes in leucofiltered products, such as plasma and red blood cells.
7.12.2 Measurements on red blood cells (RBCs)
The measurements that can be made on red blood cells include:
• Detection and quantitation of RBC-bound proteins
• Quantitation of RBC-bound immunoglobulins
• Detection and quantitation of RBC antigens and antibodies
• Detection and quantitation of minor RBC populations, including the detection and quantitation of transfused RBCs and the detection and quantitation of fetal RBCs in maternal blood (see Section 7.8).
7.13 Platelet counting and function
Flow cytometry can be used to count platelets and also to measure their surface proteins (Harrison et al., 2001, 2005, Michelson, 2006). The latter change during activation of the platelets and can be used to measure their activation state. Platelets are easily activated and blood has to be taken and handled with care; for this reason, whole blood methods are generally preferred.
Platelet analysis by flow cytometry can have application in
• Identification of inherited disorders
• Monitoring of anti-platelet therapy
• Monitoring clinical course of disease
• Monitoring platelet production in thrombocytopenia
• Identification of patients at risk of thrombosis
• Accurate platelet counting in thrombocytopenia
• Diagnosis of heparin induced thrombocytopenia
An example of CD41 expression in platelets is shown in Figure 7.4.
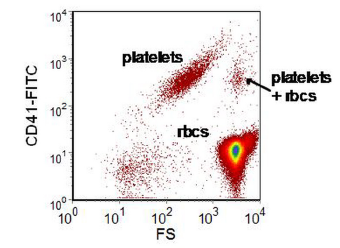
Figure 7.4. Human peripheral blood incubated with anti-CD41-FITC and then diluted 1:10000. The cluster of platelets plus red blood cells (RBC) are either coincident events or a platelet and rbc adhering to one another. If the sample is further diluted or the flow rate decreased, coincident events will decrease in number; aggregates will be unaffected.Data file
7.14 Quality Control
In clinical work, quality control is of paramount importance and each laboratory should ensure that their procedures supply the appropriate level of assurance in the validity of their results (Owens et al., 2000). Daily routine checks of instrument performance should be carried out as described in Chapter 2, Section 2.8. Laboratories undertaking routine clinical work should join a quality control scheme. Samples of cells are sent out regularly from a reference centre and each laboratory records the percentage (or in some cases, such as HIV, the absolute number) of cells in certain subsets. The data from all the laboratories is collated and any laboratory whose data fall outside the normal range is notified. Such quality control schemes are often organized on a national basis. (Reilly and Barnett, 2001).
7.15 References
Bell, A., Shenton, B. and Garner, G. (1998) The flow cytometric crossmatch in solid organ transplantation. Proc. RMS 33:219-220.
Campana, D. and Coustan-Smith, E. (2004) Minimal residual disease studies by flow cytometry in acute leukemia. Acta Haematol. 112:8-15.
Craig, F.E. and Foon, K.A. (2008) Flow cytometric immunophenotyping for hematologic neoplasms.Blood 111:3941-3967.
Davis, B.H. and Bigelow, N.C. (1994) Reticulocyte analysis and reticulocyte maturity index. In: Flow Cytometry. Methods in Cell Biology, 42 (eds. Darzynkiewicz, Z. and Crissman, H.A.). pp. 263-274. Academic Press, Inc., San Diego.
Freeman, J. And Lazarus, (1995) Applications of flow cytometry in transfusion medicine. Transfusion Medicine Reviews, 11:87-109.
Garratty, G. and Ardnt, P. (1995) Applications of flow cytofluorometry to transfusion science.Transfusion 35:157- 178.
Garratty, G. and Ardnt, P.A. (1999) Applications of flow cytofluorometry to red blood cell immunology. Cytometry 38:259-267.
Gratama, J.W., Orfao, A. and 14 other authors (1998) Flow cytometric enumeration of CD34+ hematopoietic stem and progenitor cells. Cytometry 34:128-142.
Harrison, P., Ault, K.A., Chapman, S., Charie, L., Davis, B. et al. (2001) Platelet counting by the RBC/platelet ratio method. A reference method. Am. J. Clin. Pathol. 115:460-464.
Harrison, P., Segal, H., Briggs, C., Murphy and M,. Machin, S. (2005) Impact of immunological platelet counting (by the platelet/RBC ratio) on haematological practice. Cytometry 67:1-5.
Keeney, M., Chin-Yee, I., Weir, K., Popma, J., Nayar, R. and Sutherland, D.R. (1998) Single platform flow cytometric absolute CD34+ cell counts based on the ISHAGE guidelines. Cytometry34:61-70.
Kern, W., Haferlach, C., Haferlach, T. and Schnittger, S. (2008) Monitoring of minimal residual disease in acute myeloid leukemia. Cancer 112:4-16.
Mandy F, Nicholson J, Autran B, Janossy G (2002) T-cell subset counting and the fight against AIDS: reflections over a 20-year struggle. Cytometry, 50:39-45.
Mandy, F., Janossy, G., Bergeron, M., Pilon, R. and Faucher, S. (2008) Affordable CD4 T-cell enumeration for resource-limited regions: A status report for 2008. Cytometry, 74, Suppl 1:S27-39.
Michelson, A.D. (2006) Evaluation of platelet function by flow cytometry. Pathophysiol. Haemost. Thromb. 35:67-82.
Nance, S.J., Nelson, J.M., Arndt, P,A., Lam, H.C. and Garratty, G. (1989) Quantitation of fetal-maternal hemorrhage by flow cytometry. A simple and accurate method. Am. J. Clin. Pathol. 91:288-92.
Owens, M.A., Vall, H.G., Hurley, A.A. and Wormsley, S.B. (2000) Validation and quality control of immunophenotyping in clinical flow cytometry. J. Immunol. Meth. 243:33-50.
Qadir, M., Barcos, M., Stewart, C.C., Sait, S.N., Ford, L.A. and Baer, M.R. (2006) Routine immunophenotyping in acute leukemia: Role in lineage assignment and reassignment. Cytometry70:329-334.
Reilly, J.,T and Barnett, D. (2001) UK NEQAS for leucocyte immunophenotyping: the first 10 years. Cytometry 54:508-511.
Richards, S.J., Rawstron, A.C. and Hillmen P. (200) Application of flow cytometry to the diagnosis of paroxysmal nocturnal hemoglobinuria. Cytometry 42:221-222.
Shanahan, T. (1997) Application of flow cytometry in transplantation medicine. Immunol. Invest.26:91-101.
Sutherland, D.R., Anderson, L., Keeney, M., Nayar, R. and Chin-Yee, I. (1996) The ISHAGE Guidelines For CD34+ Cell Determination By Flow Cytometry. J. Hematother. 3: 213-226.
Wood, B.L., Arroz, M., Barnett, D., DiGiuseppe, J., Greig, B., Kussick, S.J., Oldaker, T., Shenkin, M,, Stone, E. and Wallace, P. (2007) 2006 Bethesda International Consensus recommendations on the immunophenotypic analysis of hematolymphoid neoplasia by flow cytometry: optimal reagents and reporting for the flow cytometric diagnosis of hematopoietic neoplasia. Cytometry B, 72 Suppl 1:S14-22.
7.16 Further reading
Carey, J., McCoy, J. and Keren, D. (2007) Flow Cytometry in Clinical Diagnosis. 4th ed. ASCP Press.
Clinical Flow Cytometric Analysis of Hematolymphoid Cells; Approved Guideline. 2nd ed, H43-A2 Clinical and Laboratory Standards Institute (CLSI) 2007
Craig, F. (2007) Clinics in Lab Medicine - Flow Cytometry. Vol. 27 Elsevier Saunders.
Nguyen, D., Diamond, L. and Braylan, R. (2007) Flow Cytometry in Hematophology. 2nd ed. Humana Press.
Stewart, C.C. and Nicholson, J.K.A. (eds.) (2000) Immunophenotyping Cytometric Cellular Analysis. Wiley VCH.
Jaffe, E., Harriss, N., Stein, H., Vardiman, J. (2001) World Health Organization Classification of Tumors. Tumors of Haematopoetic and Lymphoid Tissue. IARC Press .