Chapter 2: The Flow Cytometer
You are here
The basic building blocks of a flow cytometer are shown in Figure 2.1.

Figure 2.1. The building blocks of a flow cytometer
2.1 The flow chamber
The flow chamber lies at the heart of the instrument. This is often called a flow cell but I have used the word chamber to avoid confusion with biological cells. It is designed to deliver the cells in single file at the point of measurement. The sample of is injected into the centre of a stream of liquid (water or buffer), called the sheath fluid. If the flow is unperturbed, the sheath fluid and the sample stream do not mix and the latter is narrowed, typically to a diameter of about 10 µm, constraining the cells to move through the centre of the chamber. At this point, light is focused (Figure 2.2).
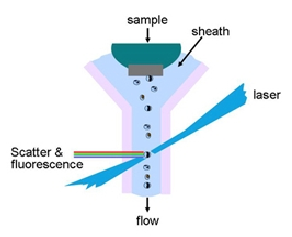
Figure 2.2. The basic features of a flow chamber. The walls are generally made of quartz.
There are two types of basic flow chambers: fully closed chambers which are used for analysis only and chambers in which the sample stream emerges into the open air, used for analysing and sorting cells. The former often have a chamber based on a quartz cuvette. Another type of design is used in microscope-based cytometers, in which the fluorescence is measured in the optical path. The top surface is usually a cover slip or equivalent.
A typical design of a chamber based on a quartz cuvette is shown in Figure 2.3. This design is suitable for a cell sorter. In bench top analysers, which cannot sort cells, the flow is usually in a vertical direction to clear any small air bubbles. As well as the sheath and the sample lines, there is also a vacuum line attached to facilitate cleaning and allow any blockages to be cleared.
A collecting lens attached to the chamber maximises the amount of fluorescence and scattered light collected.

Figure 2.3. Design of a typical analytical flow chamber.
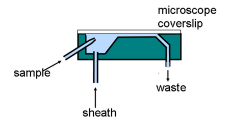
Figure 2.4. Microscope-based flow chamber (Partec).

Figure 2.5. Flow chamber used for a ‘stream-in-air’ system.
A few instruments dispense with the sheath fluid and rely on the system geometry and the sample flow to focus the stream of cells (for example, the EasyCyte from Guava Technologies.).
A chamber for a microscope-based instrument is shown in Figure 2.4.
When cells are sorted electrostatically, the sheath and sample streams emerge into the open air. There are two types of sorting chambers; one which is based the cuvette design shown in Figure 2.3; in the other the laser interrogates the cells outside the chamber (Figure 2.5). Such systems are often referred to as ‘stream-in-air’ or ‘jet-in-air’.
Further details are given in Section 2.7.
2.2 Fluidics
The elements of the fluidics are shown in Figure 2.6. Typically, the sheath fluid is driven through the flow chamber by air pressure supplied by a compressor. The same pressure is used to force the sample into the sheath. The rate of the sample flow is regulated by a pressure regulator. This may be continuously variable or fixed to three settings (high, medium and low). A pinch valve controls whether or not the sample is being introduced. Some systems deliver the sample by means of a syringe pump.
There is a vacuum system which is used to clear the flow chamber and is also used in the cleaning cycle (not shown).

Figure 2.6. The layout of fluidics for a flow cytometer.
2.3 Light sources
The light source can be a laser, an arc lamp or even an LED. Today, the majority of instruments use a laser.
Lasers are chosen because they produce a high intensity beam of monochromatic light. They also have a small ‘spot’ size, which is important since the light needs to be focused into a small volume to obtain maximum excitation of a single cell and to minimise the probability of there being more than one cell in the laser beam.
Arc lamps need optical filters to select the appropriate wavelength. They do not give the sensitivity needed to observe weak fluorescence but offer a cheaper alternative for observing strong fluorescences, for example, in DNA analysis.
There is a large variety of air-cooled and solid state lasers available. The most common primary laser is an air-cooled argon-ion laser producing blue light at 488 nm. This wavelength is convenient for the excitation of fluorescein, the first immunofluorescent label to be used. Other air-cooled lasers in general use include He-Ne (633 nm) and He-CD (325 nm).
Solid state lasers producing light at 355, 405, 488, 530, 594, 635 and 780 nm are available. Most solid state lasers produce between 10 and 25 mW. There is at least one diode laser giving 200 mW at 488 nm.
While a higher power output improves sensitivity, there is a penalty to pay in terms of increased cost, maintenance and size. A few specialized applications need higher laser powers, such as chromosome analysis and sorting, and water-cooled lasers producing 200 mW or more are used.
2.4 Optics
2.4.1 A typical arrangement
The main optical elements of the flow cytometer are outlined in Figure 2.7. This shows a possible layout for a simple instrument which would be suitable for measuring immunofluorescence from cells incubated with antibodies labelled with fluorescein, phycoerythrin (PE) and PE-cyanine5 conjugate.
The light source is a blue, argon-ion, laser that passes through a focusing lens. On the far side of the flow chamber is a bar which blocks the laser beam. The forward scatter detector sits behind the blocker bar and detects light scatter in at small angels in a forward direction. A collecting lens is placed at right angles to the laser beam. A series of dichroic mirrors (sometimes called beam splitters) select out light of different wavelengths.

Figure 2.7. The layout of a simple flow cytometer. Detailed explanation is given in the text.

Table 2.1. Properties of the optical filters shown in Figure 2.7. LWP = long pass
Note that the collecting lens is designed to produce light focused at infinity (collimated beam) so that the photomultipliers (PMTs) can be placed at any distance from the flow chamber. Alternatively, the light could be focused on pinholes placed in front of each PMT, to reduce the amount of unwanted light collected. In this case, the PMTs must be equidistant (in terms of the light path) from the flow chamber, necessitating a different layout.
The properties of the filters are outlined in Table 2.1. The first dichroic mirror selects light with a wavelength less than 500 nm (blue). After passing through a barrier filter which selects blue light (475-495 nm), the light falls on the first PMT (side scatter, SS). The second dichroic selects light below 540 nm which passes through a green barrier filter onto PMT 2. The third picks off light below 590 nm which passes through an orange filter to PMT 3 and finally the remaining light falls on PMT 4 after passing through a red filter.
2.4.2 An advanced optical layout
Figure 2.8 showsthe optical layout of a ‘state of the art’ cytometer. The instrument is a Dako-Cytomation Mo-Flo, as configured in the University of California Davis School of Veterinary Medicine. It has three lasers, giving blue, red and UV. The light from the blue (argon laser) is directed to the left where side scatter and 5 fluorescences are measured. To the right, four colours from the red (He-Ne) laser are recorded. The other station measures two fluorescences from a solid state violet laser.

Figure 2.8. The optical layout for measuring 12 colours - one scatter and eleven fluorescences. Picture reproduced with the permission of Dr. Nicole Baumgarth, UC Davis. Details are given in the text.
2.4.3 Focusing the laser beam
The light beam must be focused onto the sample stream. This can be accomplished by a simple lens giving a beam cross-section of, typically, about 50 µm. Some instruments use a elliptic lens to produce a 20 x 60 µm elliptical beam. An alternative configuration is a crossed cylindrical pair of lenses that can produce an elliptical spot of, typically, 5 x 120 µm from a laser beam of 1 mm diameter (Figure 2.9). The required profile of the laser beam can be specified by selecting the appropriate pair of lenses.

Figure 2.9. Crossed cylindrical lens pair for focusing.
Spherical, or near-spherical, beams are used with stream-in-air systems in which the diameter of the beam has to be less than that of the stream in order to minimize excessive light scatter from the stream-air interface. The higher speed of the cells in this system gives an acceptably fast signal pulse (2-7 µs) with the wide laser beam. The whole cell is illuminated as it passes through the beam and the loss of fluorescence due to the presence of an obscuration bar (used to block out most of the light reflected from the stream/air interface) is partly compensated for by the more efficient excitation of the cells.
Wide, flat beams are used with flow chambers based on quartz chambers whose more efficient collection optics compensate for the lower level of illumination of the cells. The small beam height also gives fast electronic pulses (~5 µs) from the more slowly moving cells.
An elliptically shaped beam has the advantage that the cell is illuminated more uniformly as it crosses the beam (Figure 2.10). Some information can also be derived about the shape of the cell, useful in DNA analysis (Chapter 4).

Figure 2.10. The effect of beam shape on the the laser beam intensity of light seen by an on-axis as opposed to an off-axis cell. The precise positioning of a cell in the beam is less critical for the flatter beam.
2.4.4 Epi-illumination
In instruments based on a fluorescence microscope, the excitation beam (often from an arc lamp) and the emitted fluorescence light are collected through the same lens (epiillumination).
2.4.5 Light collection
The collection lens should have as high a numerical aperture as possible in order to collect as much of the fluorescence as possible. In analysers, with cuvette flow cells, as opposed to cell sorters, it is possible to use a shorter working distance, including immersion objectives, and hence obtain a higher numerical aperture.
In a cell sorter using a stream-in-air system, the working distance of the lens is clearly limited. In cell sorters employing a quartz cuvette, the need to vibrate the flow cell (See, Section 2.7) precludes the use of an immersion objective. However, in this case, light collection may be improved by cementing a small lens onto the side of the flow cell.
2.4.6 Optical filters
A laser emits light at a single wavelength, while an arc lamp emits over a wide spectrum. Consequentially, arc lamps require optical filters to select the correct wavelength of excitation. These are usually made from coloured glass. Lasers do not need further filtration. The dichroic and bandpass filters used on the output side are normally interference filters.
Bandpass filters transmit light over a narrow band and are generally used immediately in front of a detector. Their important parameters are the peak wavelength of transmission, the percentage of light transmitted at the peak wavelength and their bandwidth (measured as the separation of the 50% transmission points) (Figure 2.11).
Dichroic filters (sometimes called beam splitters) are used in the flow cytometer at an angle often of 45°. Short wavelength pass (SWP) filters transmit light below a given wavelength and reflect light of longer wavelengths. Long wavelength pass (LWP) filters work in the reverse fashion. Their important parameters are the wavelength for 50% transmission (the cut off for LWP or the cut-on wavelength for SWP), the peak transmission and the slope at the cut-on or cut-off wavelength. Their properties depend on the angle at which they are used.

igure 2.11. Illustration of the properties of the two of optical filter use in flow cytometry.
2.5 Detectors
A solid state detector is sufficient for the measurement of forward scattered light. For measuring fluorescence and scatter at right angles to the laser beam, photomultipliers are used. The sensitivity of PMTs is dependent on the wavelength of the light. For positions used to detect wavelengths of 600 nm and over, red sensitive PMTs are selected.
2.6 Signal processing
The sections below describe how the signals from the detectors are handled by the electronics. Until recently, conventional electronic circuitry was used In most instruments. In more modern machines, the signals are converted from analogue to digital at an early stage and all subsequent processing is handled digitally. There are several advantages to digital processing, not least, accuracy and speed. The main elements of the electronics are shown in Figure 2.12.

Figure 2.12. Main elements of the electronics in a flow cytometer. ADC = analogue to digital convertor.
2.6.1 Electronic trigger
After (pre-) amplification, the signal from a photomultiplier undergoes further processing. The instrument must be set to respond to signals derived from the particle of interest (for example, a cell) and to ignore debris and 'spikes' from electronic noise. A threshold level is set on one, or possibly two, parameters such that a cell in only detected when the signal rises above this level. The selected parameter is sometimes referred to as the discriminator. It is usual to use light scatter for the trigger. An instrument may be triggered on a signal from a fluorescent stain for DNA but an immunofluorescence signal should generally never be used since negative cells might inadvertently be excluded from analysis.
It is important that the discriminator is set correctly. An incorrect setting will prevent signals being properly recorded (Figure 2.13).
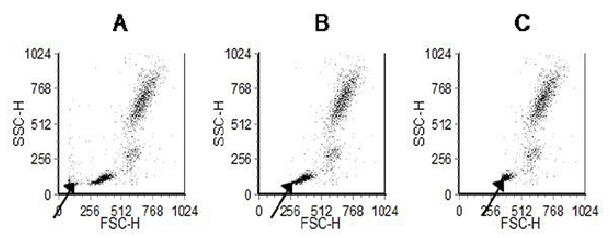
Figure 2.13. The effect of changing the discriminator setting. Display of side versus forward light scatter from human peripheral blood leucocytes. The discriminator has been set on forward light scatter. A. Discriminator is set too low allowing residual red cells and debris to be recorded. B. Discriminator set correctly. C. Discriminator set too high. Some of the smaller cells are lost. Data file
2.6.2 Pulse processing
As the cell passes through the laser beam, it will generate a signal pulse, which has a height (or peak), width and an integrated area (Figure 2.14). If the width of the laser beam is greater than that of the cell diameter, the peak (or height) of the signal will accurately reflect the total fluorescence of the cell. As this is faster and easier to record, this parameter is usually recorded. If a narrow elliptically shaped beam is used, only part of a cell may be illuminated at any given time. To produce a signal proportional to the total fluorescence of the cell, the pulse is integrated (pulse area). The width and peak of the pulse may also be recorded and this will give some information about the length of the cell passing through the beam. This information may be used in a DNA measurement to distinguish between single cells or nuclei and doublets (see Chapter 4).
The width of the pulse from forward light scatter is sometimes used to measure the ‘time of flight’ of a cell through the laser beam, and hence its length.
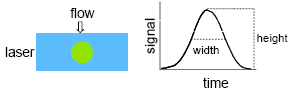
Figure 2.14. Signal generated when a cell passes through the laser beam.
2.6.3 Linear or logarithmic data display
Most cytometers offer a choice between linear and logarithmic display of the fluorescence and light scatter intensity.
For cell cycle measurement, using a stain for DNA, linear amplification should always be used. For immunofluorescence, logarithmic amplification conditions the signal such that both weak and strong signals can be recorded on the same scale. Changing to a logarithmic display has the effect of compressing the scale for positive events and broadening the scale for negative events. As a result, by eye, the observer has a better impression of the ratio between positive and negative events. The actual number is, of course, the same.
Figure 2.15 shows data from human lymphocytes obtained using fluorescein-labelled antibodies to CD8. Note that with a linear scale, the negative events are hard up against the y-axis. The scale of the y-axis had to be reduced to allow the positive events to be observed. Some positive events are too bright to be accommodated on the x-axis and are off-scale.

Figure 2.15. CD8 expression on human lymphocytes. The data was recorded using both linear and logarithmic amplification. Data file
2.7 Cell sorting
2.7.1 Introduction
There are two methods of sorting cells using a flow cytometer. The commonest method is by electrostatic deflection of charged droplets. Alternative methods use piezo-electric devices to sort the cells mechanically.
2.7.2 Sorting by deflection of charged droplets
A conductive sheath fluid is used (buffered saline). The flow chamber is vibrated vertically by means of a piezoelectric transducer at a frequency usually between 20 and 60 kHz kHz. This vibration causes the fluid emerging from the exit nozzle (typically 75 µm diameter) to break up into droplets. The flow chamber, and hence the flow stream, is charged (± v where v typically lies between 50 and 150 V) at the moment a cell of interest is inside the droplet currently being formed. The stream of droplets passes through a pair of charged plates (± 5000 V) so that the charged droplets are deflected and collected together with the cell contained therein (Figure 2.16). Therefore cells in any two pre defined gates can be sorted by using a +ve or -ve charge.
The decision about whether a cell should be sorted or not is taken as it passes through the laser beam. To ensure that the flow chamber is charged at the correct moment, the time delay between a cell passing the laser beam and the droplet break off point has to be determined and fed into the computer making the sort decision. Anything that influences the position of the break off point (a change in temperature, a draught, dirt in the flow cell orifice) will adversely affect the stability of the sorter. Deflecting and collecting more than one droplet for each cell sorted will minimize the influence of small changes in sorting conditions.
Occasionally there will be more than one cell in the deflected droplets. The electronic circuitry can detect these coincidences and if high purity (at the expense of a slightly lower yield) is desired, the sort decision can be aborted.

Figure 2.16. Sorting cells by droplet deflection.
Under ideal conditions, cells can be sorted with a purity of 98% or better. Although the purity is high, the yield is low compared to many other methods of cell separation.
Assuming a flow rate of 5000 cells s-1, if the concentration of the sub-population to be sorted is 10% and allowing for some losses through rejection of coincidences, the maximum number of cells collected will be about 2.106 h-1.
The sorting rate depends upon the percentage of the desired cells in the population, the rate at which the cells are measured and the droplet frequency. 'Stream-in-air' sorters will have a higher sorting rate because the cells have a higher flow rate. The slower flow rate in a cuvette system can be counteracted by using a narrow waisted laser beam and introducing a constriction within the flow chamber.
The droplet size can be decreased and hence the droplet formation frequency (and in 'stream-in-air' configuration, the flow rate) increased by decreasing the diameter of the flow chamber orifice. The minimum size of orifice is determined by the size of the cells being sorted. The flow rate can also be increased by increasing the sample pressure.
There are commercial instruments specifically designed for high speed cell sorting (Dako Cytomation MoFlo, BD Aria). They can achieve a maximum flow rate of up to 70,000 cells s-1. By using two different voltages on the charging pulse, they can also sort four populations (two to each side)
2.7.3 Sorting cells mechanically
In some sorters, separation of a desired population is achieved by deflecting the cell out of the main stream, using a piezo-electric device. For example, in the Partec PAS III machine, a piezoelectric fluidic valve operates on one arm of a Y-shaped flow channel, the cells to be collected being deflected down one arm of the Y. This sorter can be used for sorting large particles, such as protoplasts, because it avoids the limitations of size imposed by the need for accurate droplet formation in the electrostatic sorters.
Piezo-electric cell sorters have the advantage that, once they have been set up, they are very stable. They do not need to be calibrated or adjusted - just switched on. They have disadvantages. Because they operate mechanically, they are limited to sorting a maximum of 300 cells s-1 and the collection vessel receives a constant stream of sheath fluid, diluting the sorted cells. Only a single population of cells can only be sorted.
2.8 Measuring instrument performance
The performance of a flow cytometer is judged by its sensitivity, which can be defined either from the fluorescence threshold or from its resolution (Wood and Hoffman, 1998). The fluorescence threshold is the lowest signal from a fluorescent particle that can be distinguished from background; the resolution is the degree to which the instrument can distinguish non-fluorescent and dimly fluorescent populations in a mixture.
The sensitivity will depend on the efficiency of light collection, the gain of the electronic amplifiers and the background noise. Noise has two elements - electronic noise and extraneous light falling on the light detector (for example, scattered light not excluded by the optical filters). These factors are a function of the design of both the optical and electronic components of the instrument.
Sets of calibrated fluorescent beads, including a non-fluorescent population can be purchased. The fluorescence of the beads is recorded using logarithmic amplification and the sensitivity estimated from a plot of Molecules of Equivalent Soluble Fluorochrome (MESF) (see Chapter 5, Section 5.3) against channel number.
The general performance of the instrument should be checked daily using standard beads, fluorescent and non-fluorescent. For given laser power, the channel number of the beads in a fluorescent histogram at a fixed amplifier setting should be recorded. If there is a decrease in the channel number of the fluorescent beads or an increase in the channel number for the non-fluorescent beads, the cleanliness of the flow cell and alignment of the instrument should be checked. These procedures should form part of any quality control process in the flow cytometry laboratory.
2.9 Reference
Wood, J.C.S. and Hoffman, R.A. (1998) Evaluating fluorescence sensitivity on flow cytometers: an overview. Cytometry, 33: 256-259.
2.10 Further reading
Van Dilla, M.A., Dean, P.N., Laerum, O.D. and Melamed, M.R. (eds.) (1985). Flow cytometry instrumentation and data analysis. Academic Press, Orlando.
Wood, J.C.S. (1993). Clinical Flow Cytometry Instrumentation. In: Clinical Flow Cytometry. Principles and Applications. (eds. Bauer, K.D, Duque, R.E. and Shankey, T.V.), pp. 71-92. Williams and Wilkins, Baltimore.